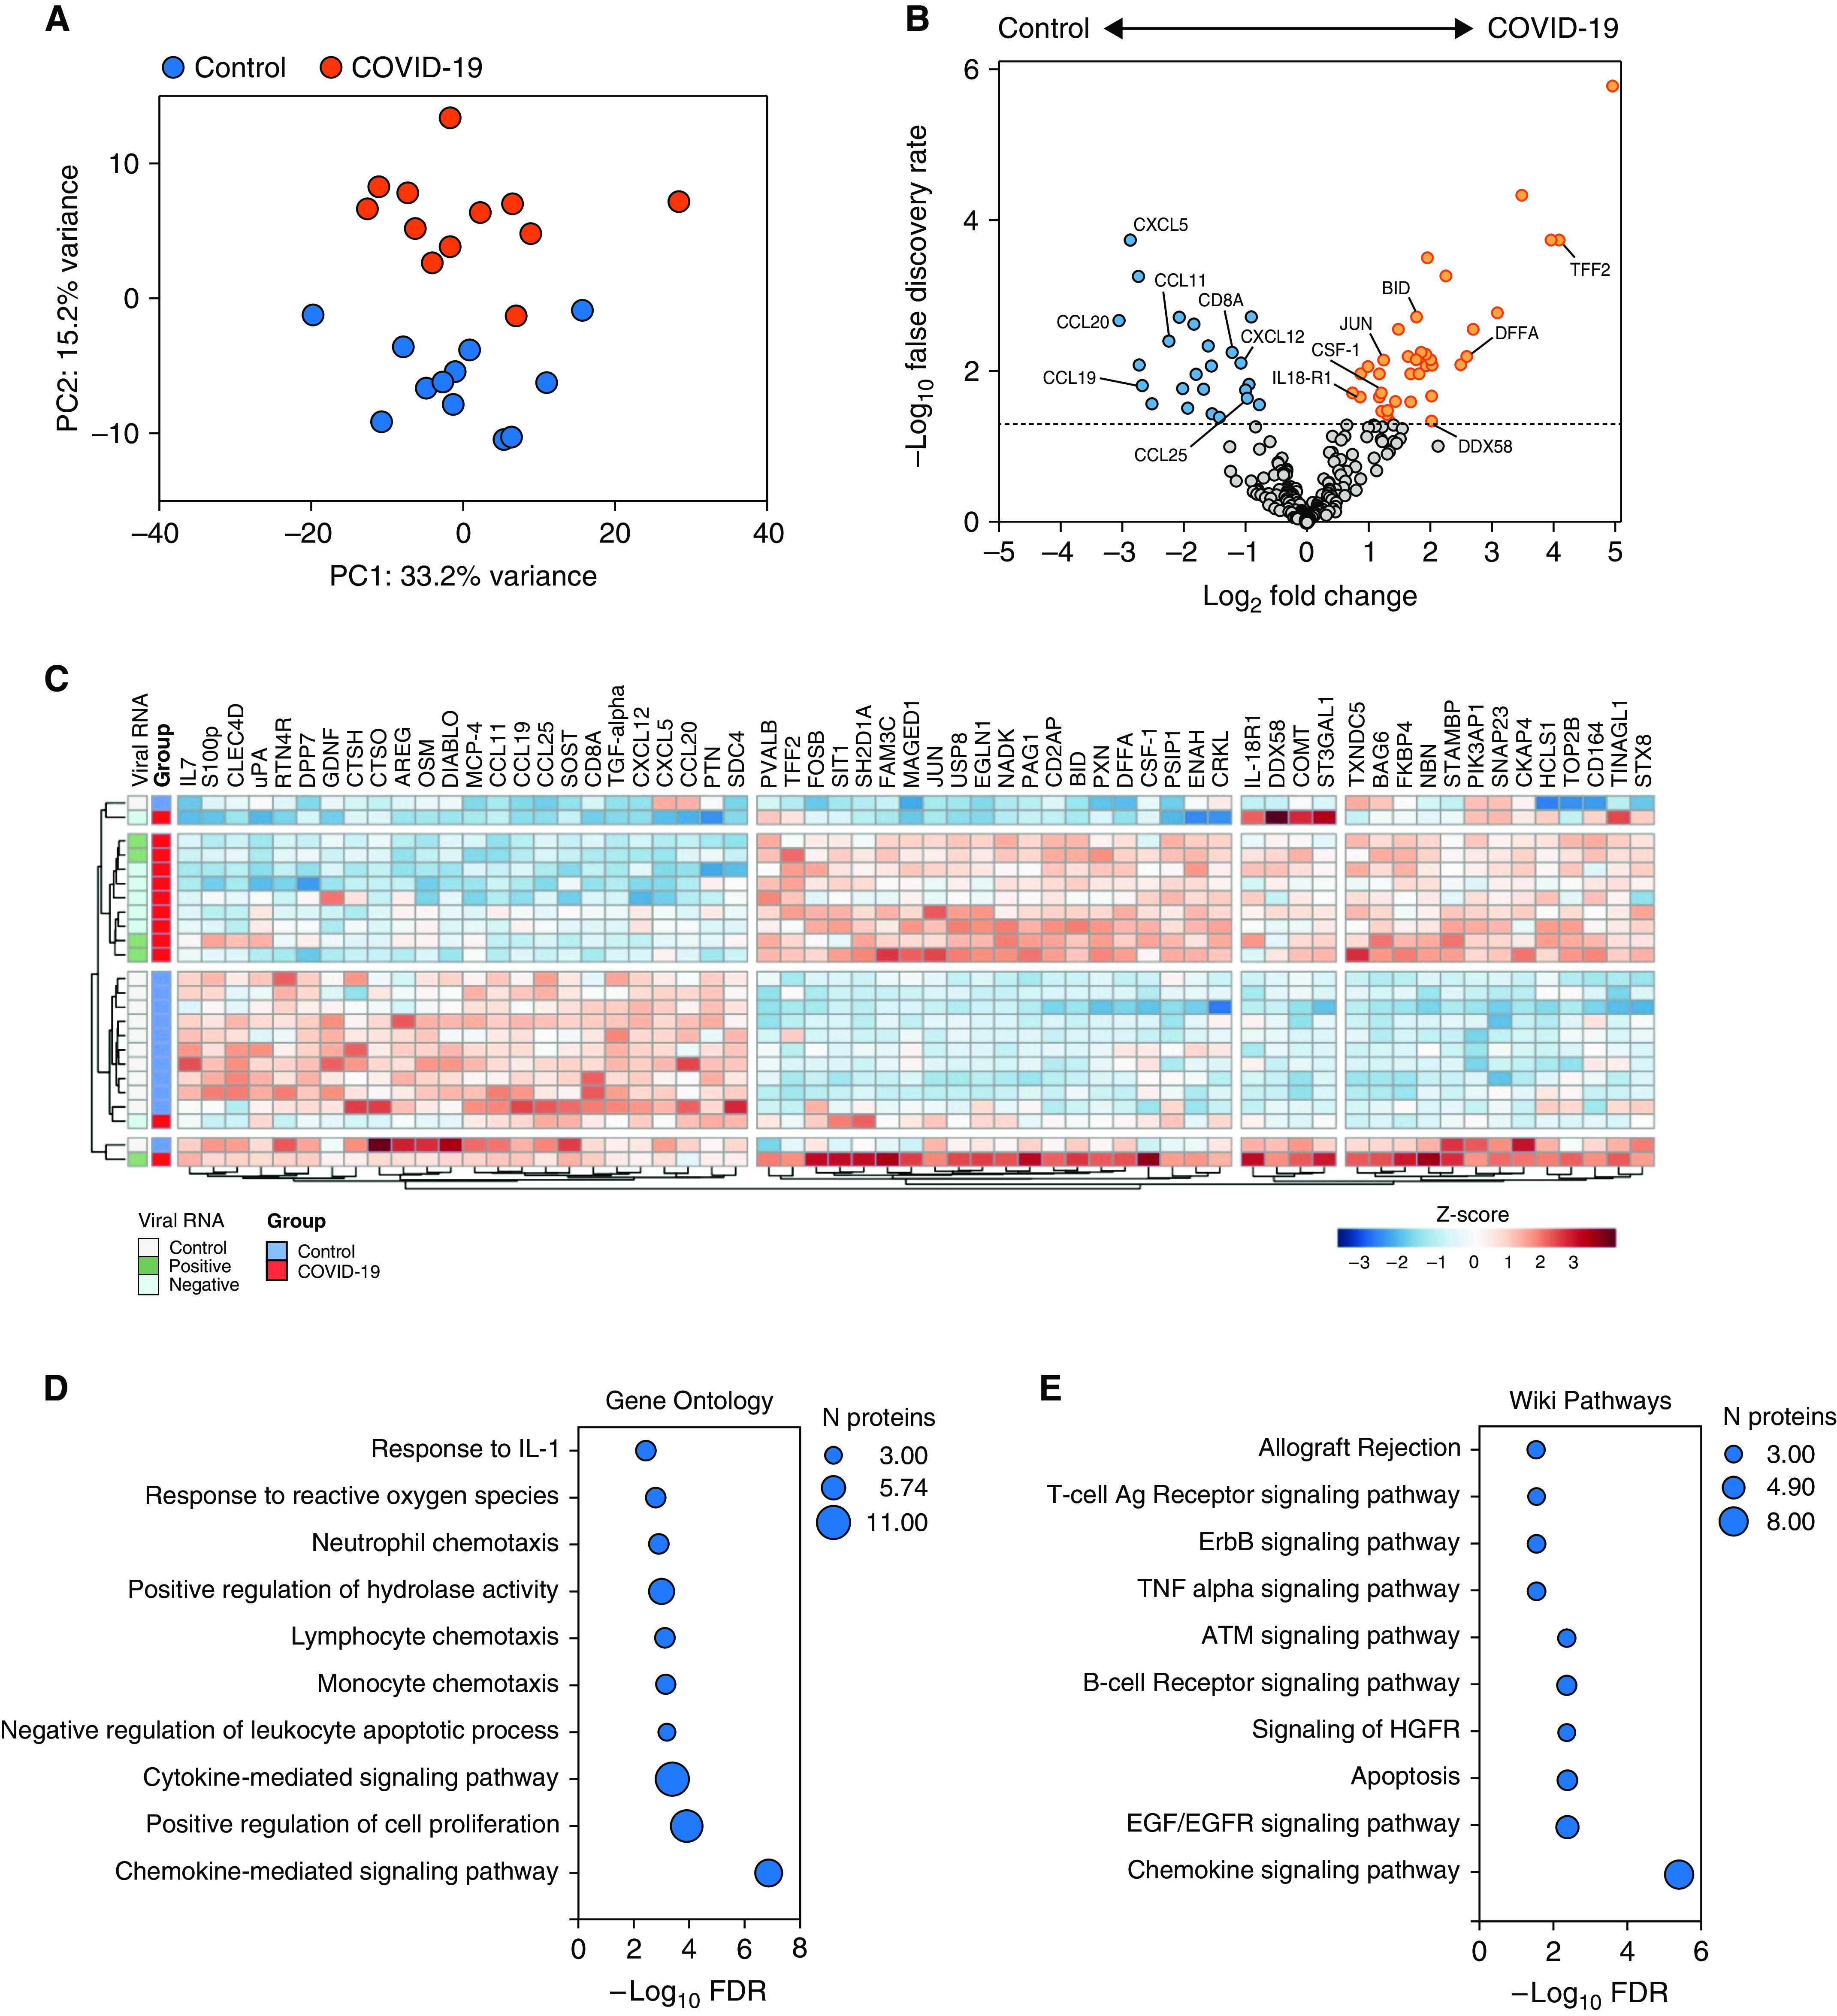
Figure 2.

Proteomic analysis of splenic tissue in fatal COVID-19. (A) Principal component analysis of 316 protein concentrations in splenic tissue from patients with fatal COVID-19 and deceased organ donors (control subjects). COVID-19 samples are shown in red and control samples in blue. (B) Differential protein abundance. Volcano plot of log2 fold change difference in protein abundance between COVID-19 and control samples. Horizontal dotted line indicates FDR of 0.05. Genes are colored based on differential abundance (FDR < 0.05): increased (orange), decreased (blue), or no difference (gray). (C) Clustered heatmap of differential protein abundance. Clusters of proteins (columns) and patients (rows) were determined by hierarchical clustering and are represented by dendrograms. Viral presence is shown by colored annotation. Shading of cells represents the z-score, computed on a protein-by-protein basis. Gene set enrichment of differentially abundant proteins in fatal COVID-19 spleen tissue (FDR < 0.05) using the (D) Gene Ontology Biological Processes and (E) WikiPathways databases.
