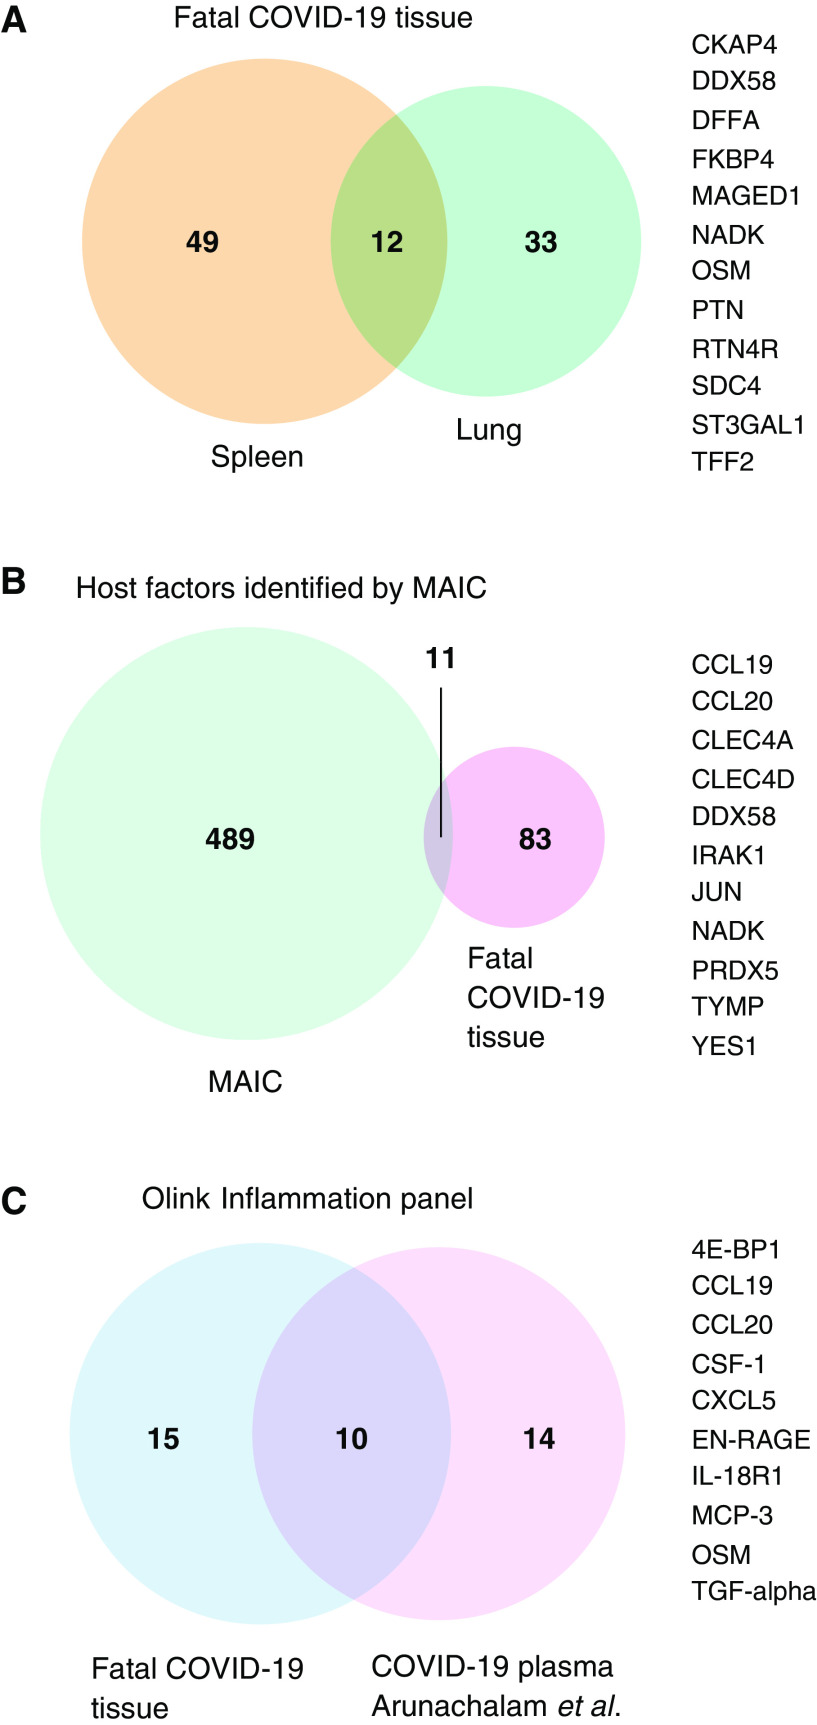
Figure 3.
Overlap of differentially abundant tissue proteins with other datasets. Venn diagrams (VennDiagram; R Studio) illustrating the overlap in (A) differentially abundant proteins between spleen and lung tissue from this study, (B) differentially abundant tissue proteins from this study and the top 500 results from COVID-19 meta-analysis by information content (MAIC), and (C) differentially abundant tissue proteins from this study (restricted to Olink Inflammation panel) and plasma proteins reported by Arunachalam and colleagues also using the Olink Inflammation panel. Overlapping proteins are listed to the right of the Venn diagrams.

