Figure 5.

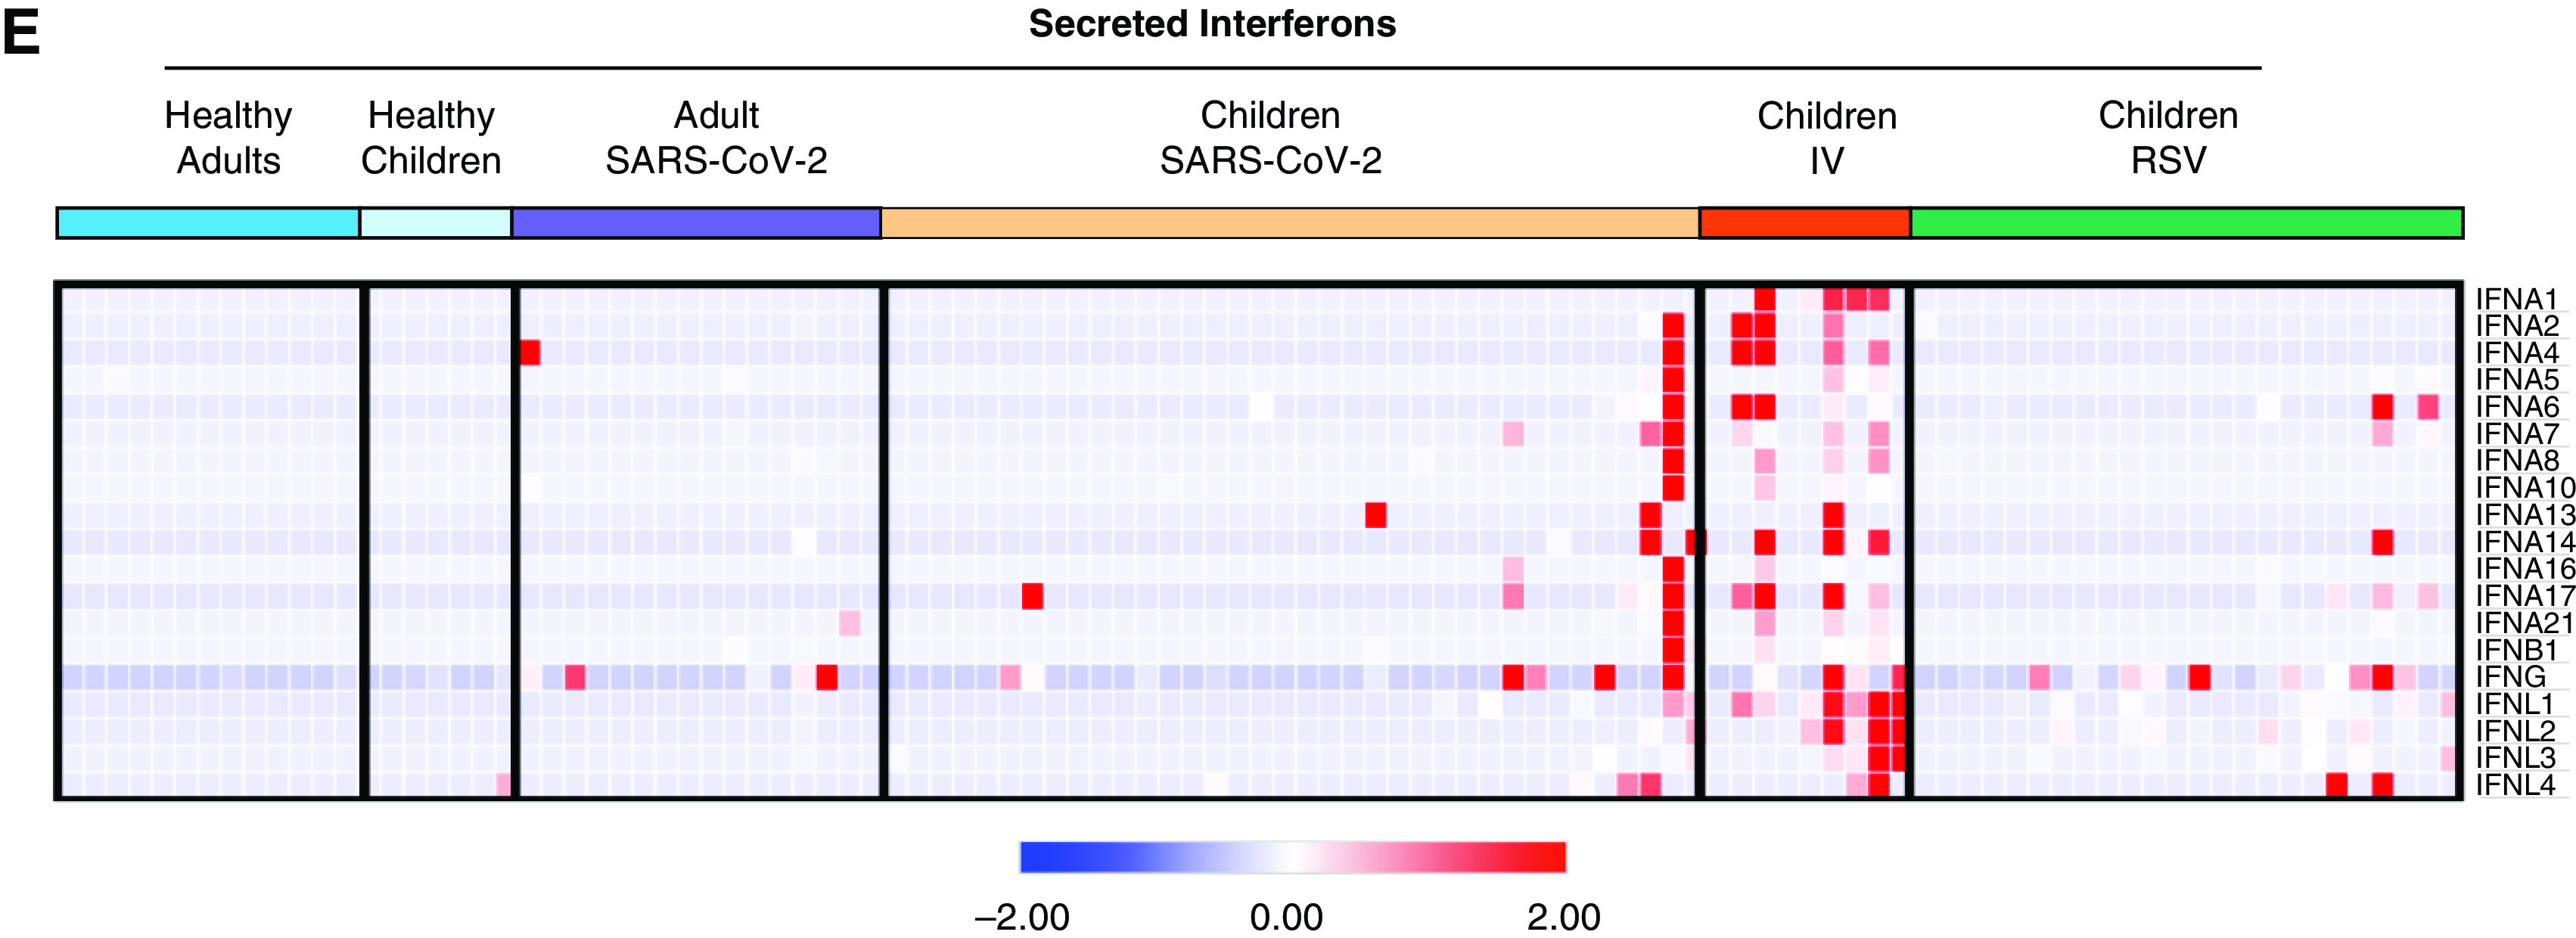
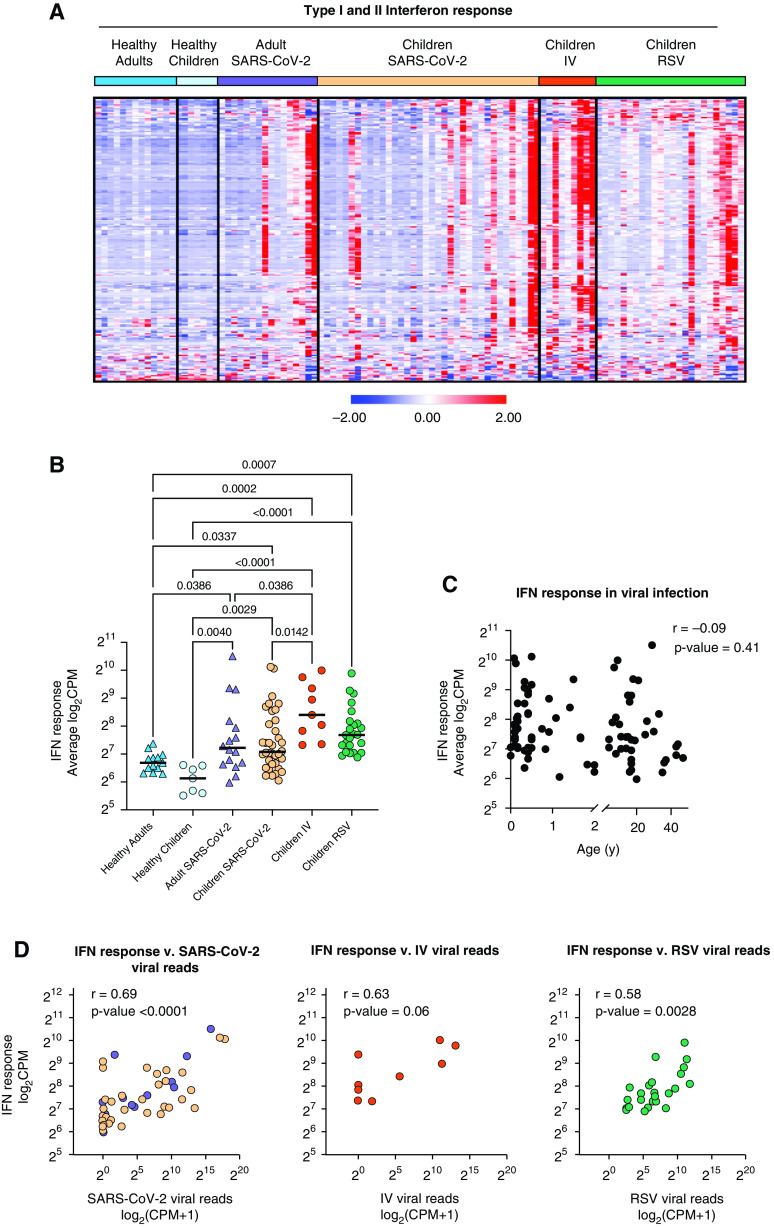
Local IFN response is independent of age and virus. (A) Heatmap of z-score normalized expression (CPM) of 222 type I and II IFN response genes. Hierarchical clustering on genes (rows) did not identify distinct clusters. Samples within SARS-CoV-2, IV, and RSV groups are ordered by ascending viral reads for SARS-CoV-2, IV, or RSV, respectively. (B) Average normalized expression of IFN response genes (combined Hallmark pathway lists for IFN-α and IFN-γ response) by participant group. (Adjusted P value < 0.05 is considered statistically significant, Kruskal-Wallis test with Benjamini-Hochberg FDR correction). Log-transformed CPM counts are shown. (C) Scatter plot of correlation between age (years) and average IFN response reads. Log-transformed CPM counts are shown. Pearson correlation coefficient (r) and P value are shown. (D) Scatter plot of correlation between average IFN response reads (log2CPM) and SARS-CoV-2, RSV, or IV viral reads, respectively. Pearson r values and P values are shown. (E) Heatmap of z-score normalized expression (CPM) for 19 secreted type I, II, and III IFNs.

