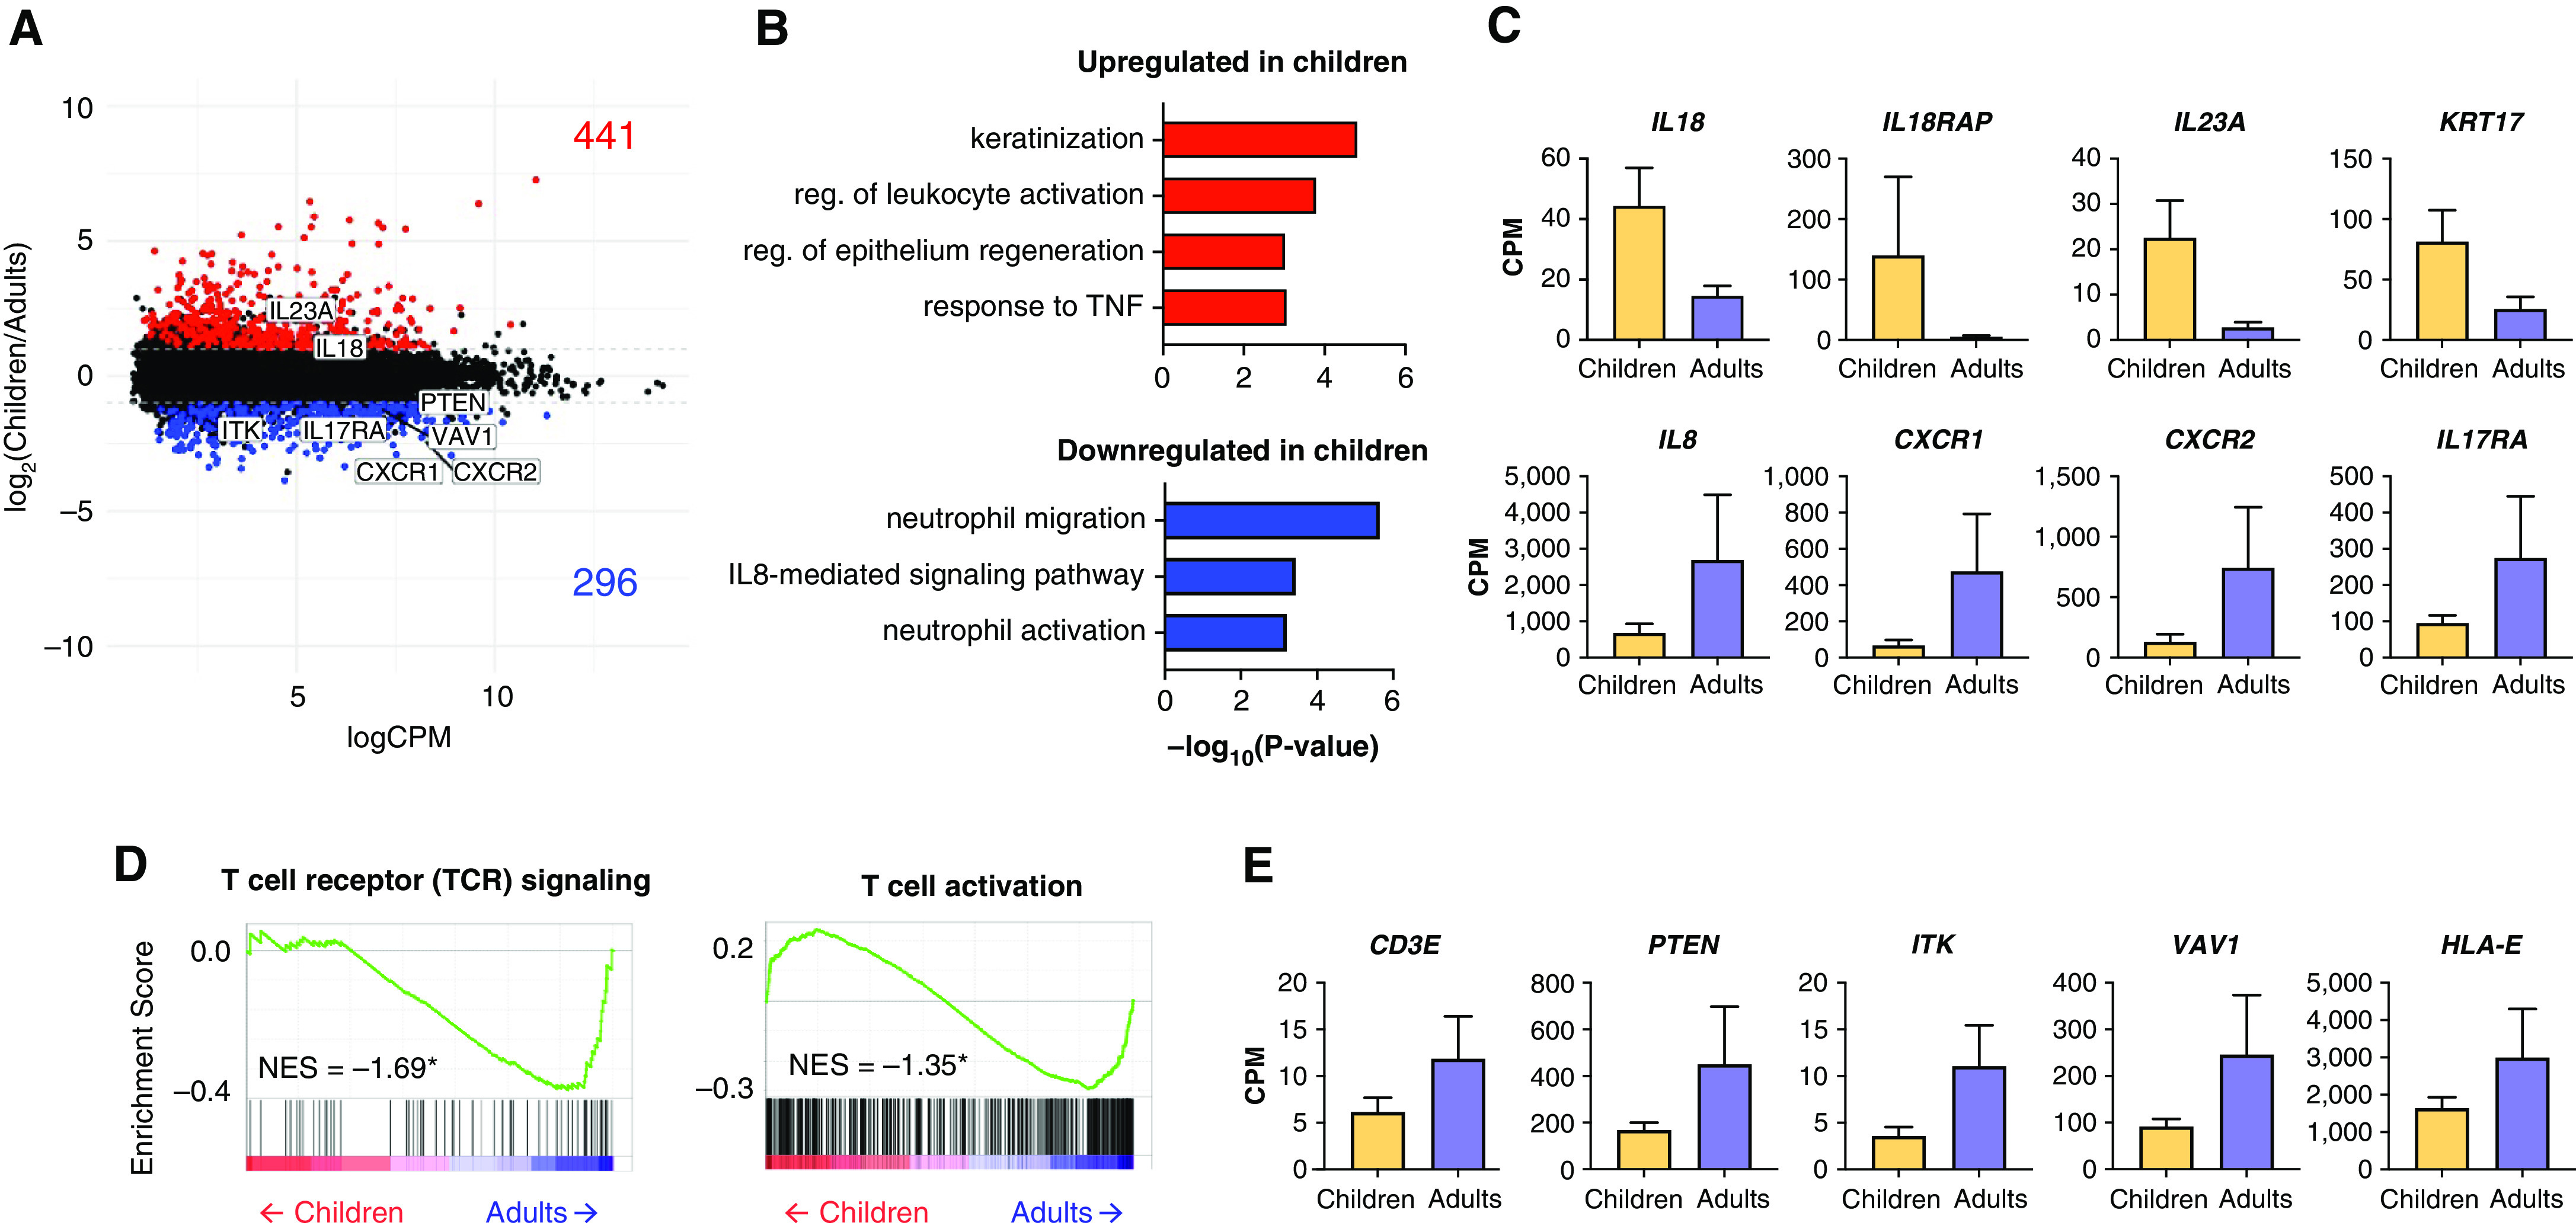
Figure 6.

Adults, but not children, with asymptomatic to mild disease upregulate TCR signaling, T-cell activation, and neutrophil activation genes with equivalent viral loads (A) MA plot of differentially expressed genes (edgeR P value < 0.05 and log2FC = |1.0|) between adults and children with mild, asymptomatic disease and high SARS-CoV-2 viral load (>6 CPM average). Numbers of genes upregulated (red) and downregulated (blue) in children compared with adults are shown. (B) Genes upregulated in children (red) enriched for keratinization and epithelial repair GO biological processes. Genes upregulated in adults (blue) enriched for neutrophil-related GO biological processes. (C) Bar graphs of gene expression (CPM) for representative up- and downregulated genes in children compared with adults are shown. All differentially expressed genes shown passed the cutoff as defined in the MA plot in panel (A): edgeR P value < 0.05 and log2FC > |1.0|, and are statistically significant. Error bars represent SEM. (D) Gene set enrichment analysis enrichment plots demonstrating TCR signaling and T-cell activation is negatively enriched in children compared with adults. Gene set enrichment analysis was performed on gene lists ranked by edgeR reported fold-change between children and adults with mild, asymptomatic disease and high SARS-CoV-2 viral load (>6 CPM average). Normalized enrichment scores (NES) are shown. *Statistically significant FDR values < 0.05. (E) Bar graphs of gene expression (CPM) for representative leading-edge genes, upregulated in adults, are shown. Error bars represent SEM.
