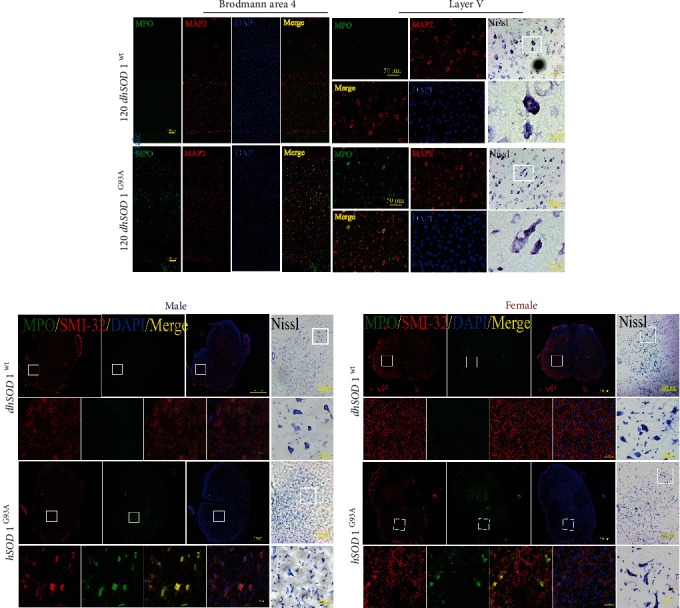
Figure 5.

The cellular distribution of MPO-positive signals and Nissl staining in the motor cortex of male mice and spine of all mice. (a) The costaining of MPO (green), MAP2 (red), and DAPI (blue) at P120 in Brodmann area 4, bar = 100 μm (zoom in layer V, bar = 50 μm), and representative images of Nissl staining, bar = 50 μm (zoom in, bar = 12.5 μm). (b, c) The costaining of MPO (green), SMI-32 (red), and DAPI (blue) at P120 in lumbar ventral horn, bar = 500 μm (zoom in, bar = 50 μm), and representative images of Nissl staining, bar = 200 μm (zoom in, bar = 50 μm).
