Figure 2.

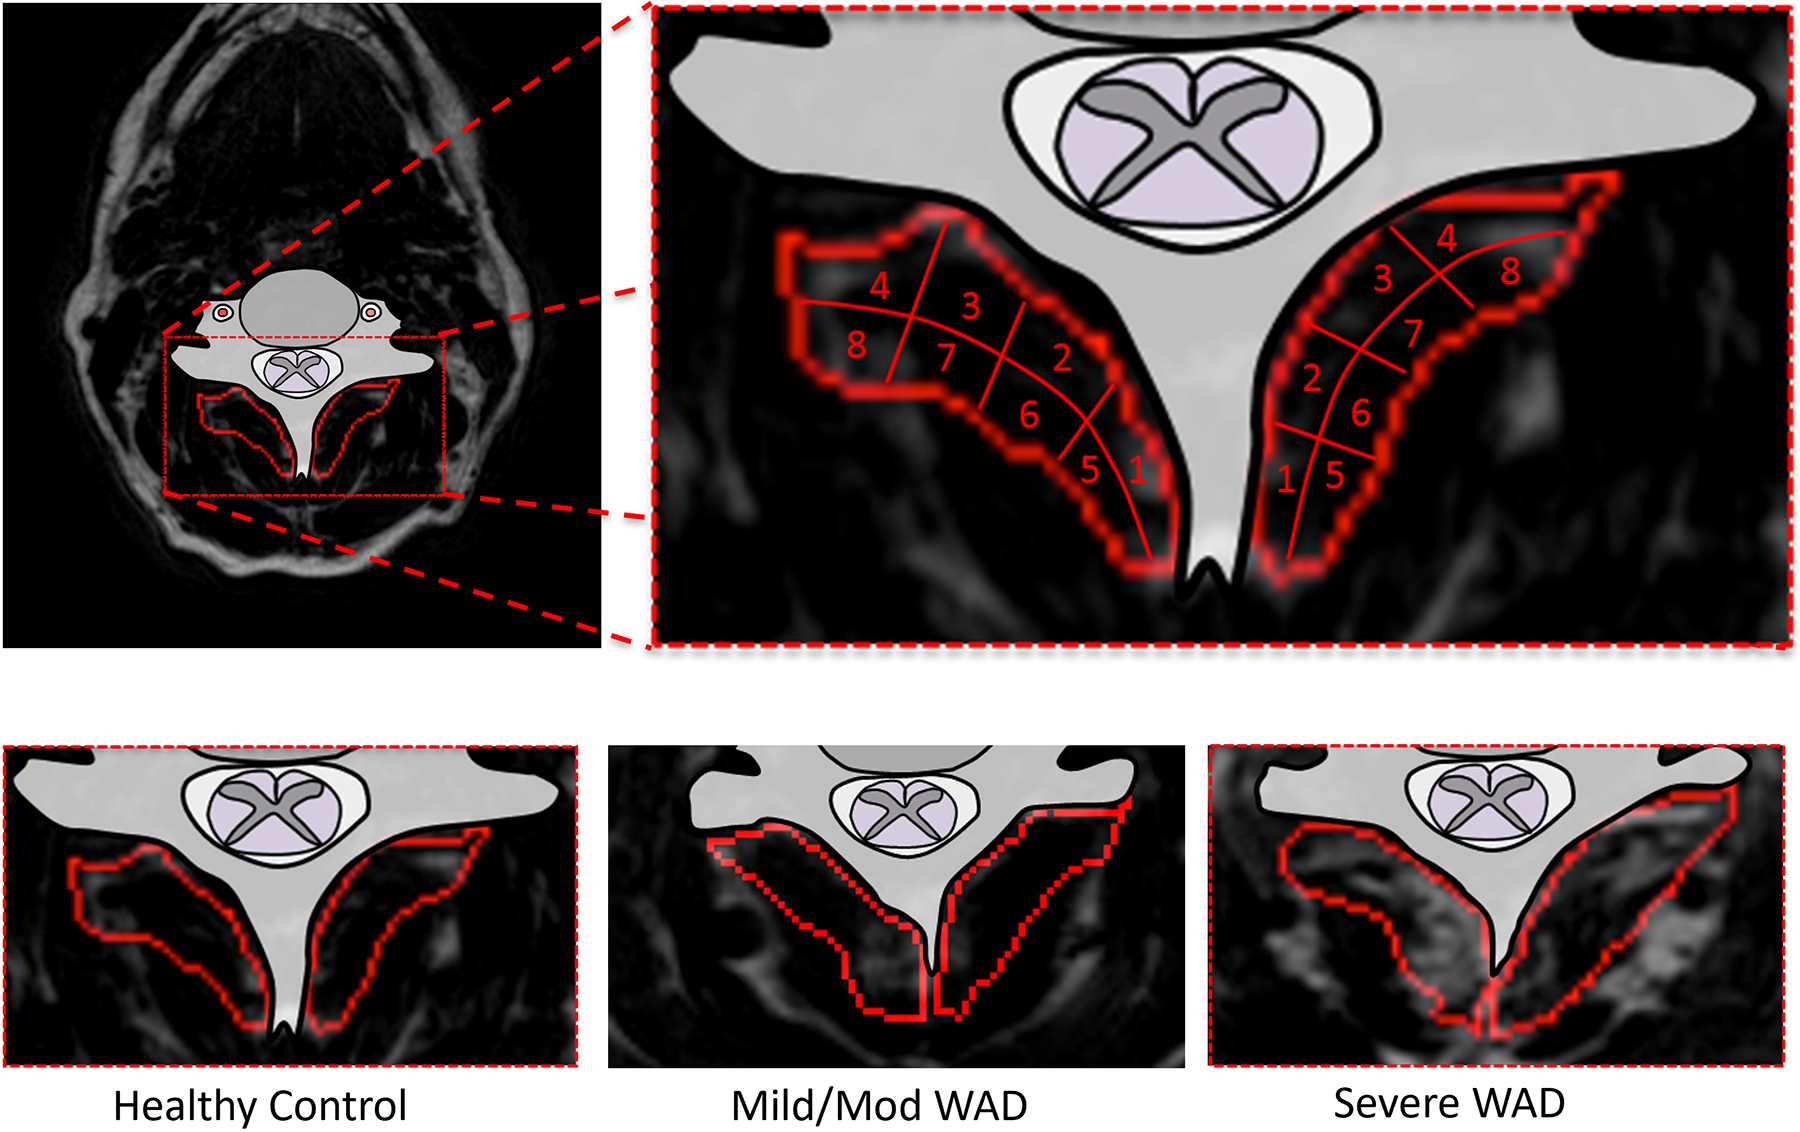
Top: Fat MR image with the multifidus muscle outlined. The muscle is then divided into eight regions for visual fat interpretation. Bottom: Example fat images of a healthy control, mild or moderate WAD, and a severe WAD participant.

Top: Fat MR image with the multifidus muscle outlined. The muscle is then divided into eight regions for visual fat interpretation. Bottom: Example fat images of a healthy control, mild or moderate WAD, and a severe WAD participant.