Fig. 1.
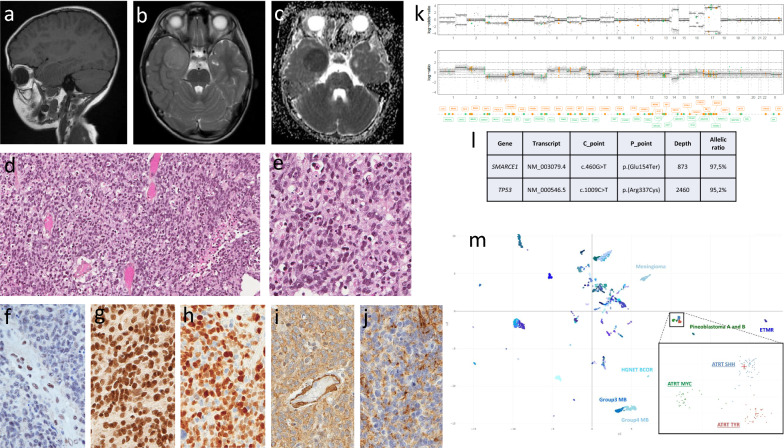
a MRI sagittal plane, T1 sequence without gadolinium injection showing a hypointense right temporal tumor. b MRI axial plane, T2 sequence showing a hyperintense right temporal tumor. c MRI axial plane, apparent diffusion coefficient (ADC) values showing a low ADC in the right temporal tumor. d, e Hematoxylin and Eosin (H&E) stain × 200 (d) and × 400 (e) showing a hypercellular tumor with pleomorphic cells harboring numerous mitoses. f SMARCE1 immunohistochemistry, × 400, showing a lack of expression in tumor cells with positive cells in a vessel as an internal control. g BAF47 immunohistochemistry, × 400, showing a maintained nuclear expression in tumor cells. h olig2 immunohistochemistry, × 400, showing a diffuse nuclear expression in tumor cells. i α-smooth actin immunohistochemistry, × 400, showing a cytoplasmic expression in tumor cells. j EMA immunohistochemistry, × 400, showing a patchy expression in tumor cells. k Copy number variation profile showing a complex profile. l Details of SMARCE1 and TP53 pathogenic variants. m UMAP showing the close localization of the tumor with ATRT

