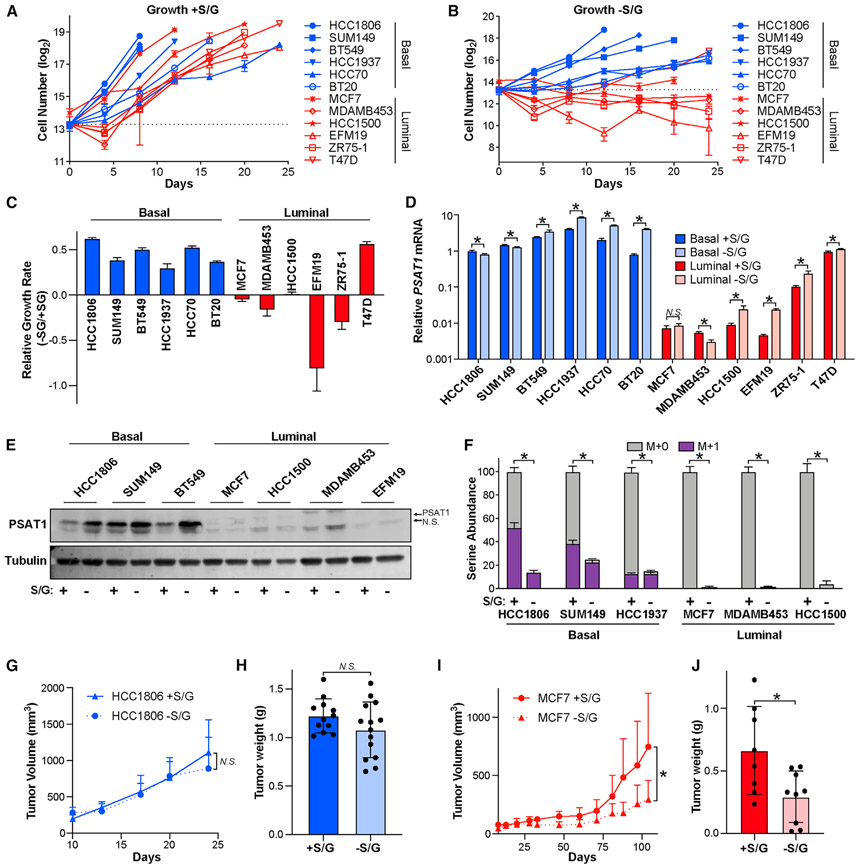
Figure 2. Luminal breast cancer cells are auxotrophic for serine.
(A and B) Basal and luminal breast cancer cell lines were cultured in normal HPLM media (+S/G) (A) or HPLM without S/G (−S/G) (B), and cell numbers were counted for 24 days or until cells became confluent. S/G starvation began on day 2. The dashed line indicates the number of cells plated per well.
(C) Relative growth rates of basal and luminal breast cancer cells grown in the presence and absence of S/G.
(D) PSAT1 mRNA level in basal and luminal lines treated with and without S/G for 48 h. Values are the means ± SDs of triplicate samples from an experiment representative of 3 independent experiments. *p < 0.05 from unpaired 2-sided t tests. N.S. (not significant) indicates p > 0.05.
(E) Representative western blot of basal and luminal cell lines treated with and without S/G for 48 h.
(F) Serine abundance and biosynthesis in basal and luminal lines treated with and without S/G for 48 h. M + 1 (in purple) indicates “heavy” serine made in the serine synthesis pathway. Values are the means ± SDs of triplicate samples from an experiment representative of 2 independent experiments. *p < 0.05 from unpaired 2-sided t tests on serine abundance data.
(G) Tumor volume over time after injecting HCC1806 cells into the mammary glands of nude mice fed with or without S/G diet. Values are the means ± SDs. n = 12 tumors for with S/G and n = 14 tumors for without S/G. N.S. indicates p > 0.05 in mixed-effects model analysis.
(H) HCC1806 tumor weight as measured at endpoint. Values are the means ± SDs (n = 12 tumors for with S/G and n = 14 tumors for without S/G). N.S. indicates p > 0.05 in 2-sided Welch’s t test.
(I) Tumor volume over time after injecting MCF7 cells into the mammary glands of nude mice fed with or without S/G diet. Values are the means ± SDs (n = 8 tumors for with S/G and n = 9 tumors for without S/G). *p < 0.05 in mixed-effects model analysis.
(J) MCF7 tumor weight as measured at the endpoint. Values are the means ± SDs (n = 8 tumors for with S/G and n = 9 tumors for without S/G). *p < 0.05 in 2-sided Welch’s t test.

