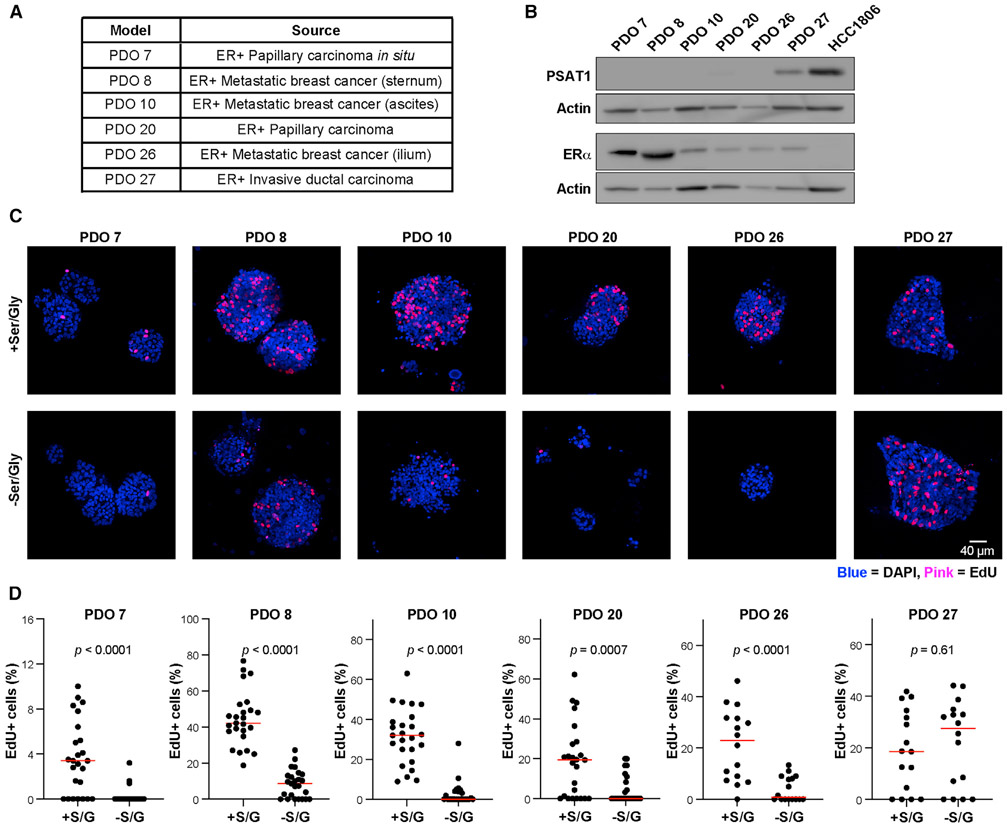
Figure 4. PSAT1 expression predicts sensitivity to serine starvation in patient-derived ER+ breast cancer organoids.
(A) Clinical characteristics of the 6 patient-derived organoid (PDO) models.
(B) Western blot for ERα and PSAT1 in PDO models. HCC1806 basal breast cancer cell lysate is included as an ER−/PSAT1 high reference.
(C) Representative confocal images of DAPI (blue) and EdU (pink) staining in PDO models treated with or without S/G for 10 days.
(D) Quantification of EdU staining in PDO models. %EdU+ cells were calculated by dividing the number of EdU+ cells by the total number of cells in either 16 or 25 organoids per group. p values are from unpaired Student’s t tests.

