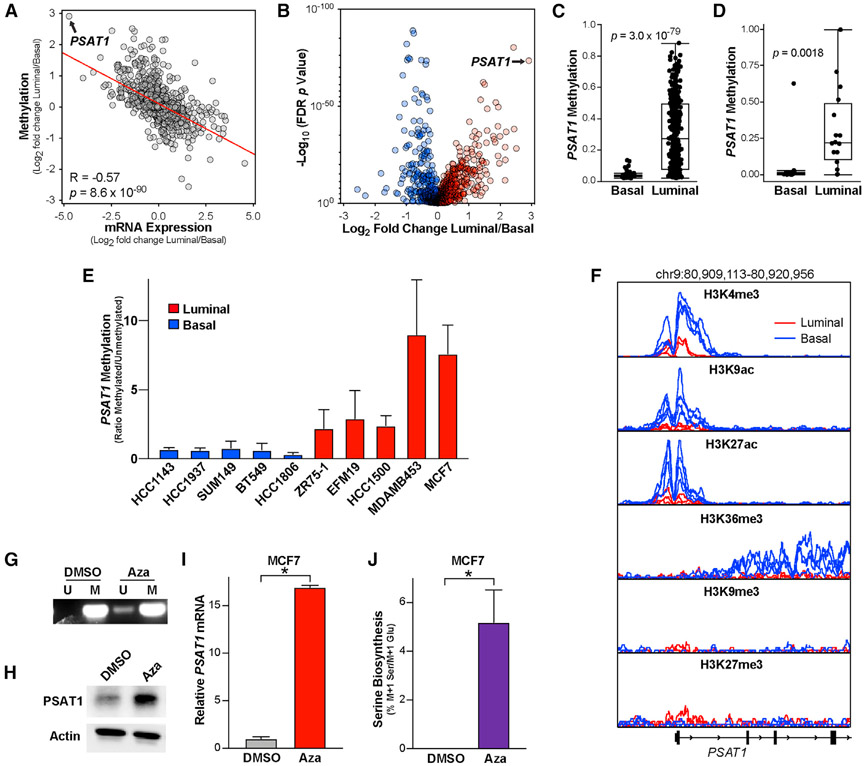
Figure 5. PSAT1 is epigenetically silenced specifically in luminal breast cancer cells.
(A) Pearson correlation of fold changes in mRNA expression and DNA methylation between luminal and basal TCGA breast tumor samples.
(B) Differences in metabolic gene methylation between luminal and basal breast tumors in the TCGA DNA methylation dataset. Data are the log2 fold change of mean gene methylation in luminal breast tumors relative to basal breast tumors. −Log10 p values from 2-sided Welch’s t tests that have been corrected for false discovery rate using the Benjamani-Hochberg method.
(C) PSAT1 DNA methylation in basal and luminal breast tumors in the TCGA dataset. p value from 2-sided Welch’s t test.
(D) PSAT1 DNA methylation in basal and luminal breast cancer cell lines in the CCLE DNA methylation dataset. p value from 2-sided Welch’s t test.
(E) Quantitation of the ratio of methylated over unmethylated PSAT1 DNA in basal and luminal breast cancer cells. Values are the means ± SEMs from 2–4 independent experiments.
(F) Analysis of H3K4me3, H3K9ac, H3K27ac, H3K36me3, H3K9me3, and H3K27me3 ChIP-seq data from luminal (MCF7, ZR751,and MDAMB361, red) and basal (MDAMB231, MDMB436, MDAMB468, and HCC1937, blue) cell lines. Data are adapted from Franco et al. (2018).
(G) Representative methylation-specific PCR detecting methylated (M) and unmethylated (U) PSAT1 promoter DNA in MCF7 cells treated with azacytidine (5 μM) for 3 days.
(H and I) PSAT1 protein (H) and mRNA (I) levels in MCF7 cells treated with azacytidine (5 μM for 3 days). Western blot is representative of 2 independent experiments. qPCR values are the means ± SDs of triplicate samples from an experiment representative of 3 independent experiments. *p < 0.05 in an unpaired 2-sided t test.
(J) Serine biosynthesis in MCF7 cells treated with azacytidine (5 μM for 3 days). Values are the means ± SDs of triplicate samples from an experiment representative of 2 independent experiments. *p < 0.05 in an unpaired 2-sided t test.

