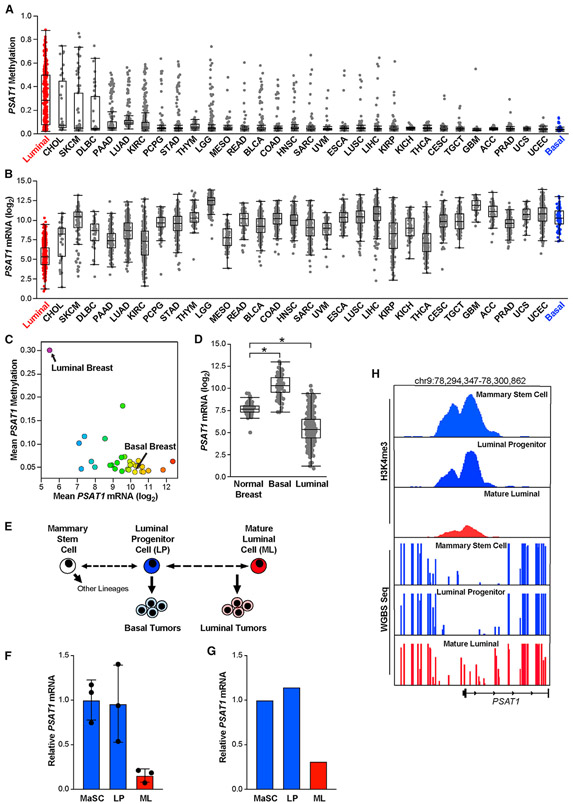
Figure 6. PSAT1 tumor phenotypes preexist in luminal tumor cells of origin.
(A and B) PSAT1 gene methylation (A) and mRNA expression (B) by tumor type in the TCGA Pan-Cancer Atlas datasets. TCGA study abbreviations listed in Figure 1A legend.
(C) Mean PSAT1 methylation and mRNA expression by tumor type in the TCGA Pan-Cancer Atlas datasets.
(D) PSAT1 mRNA levels in normal breast tissue relative to basal and luminal breast tumors in TCGA breast cancer RNA-seq data. *p < 0.05 in 2-sided Welch’s t tests.
(E) Simplified model of the proposed mammary epithelial stem cell hierarchy.
(F) Analysis of PSAT1 mRNA expression in sorted mammary stem cells (MaSCs), luminal progenitor cells (LPs), and mature luminal cells (MLs) derived from normal human mammary glands. Microarray data adapted from Lim et al. (2009). *p < 0.05 in an unpaired 2-sided t test.
(G) Analysis of PSAT1 mRNA expression in sorted MaSC, LP, and ML cells. RNA-seq data adapted from Pellacani et al. (2016).
(H) Analysis of PSAT1 H3K4me3 ChIP-seq and whole-genome bisulfate sequencing data in sorted MaSC, LP, and ML cells. Data adapted from Pellacani et al. (2016).

