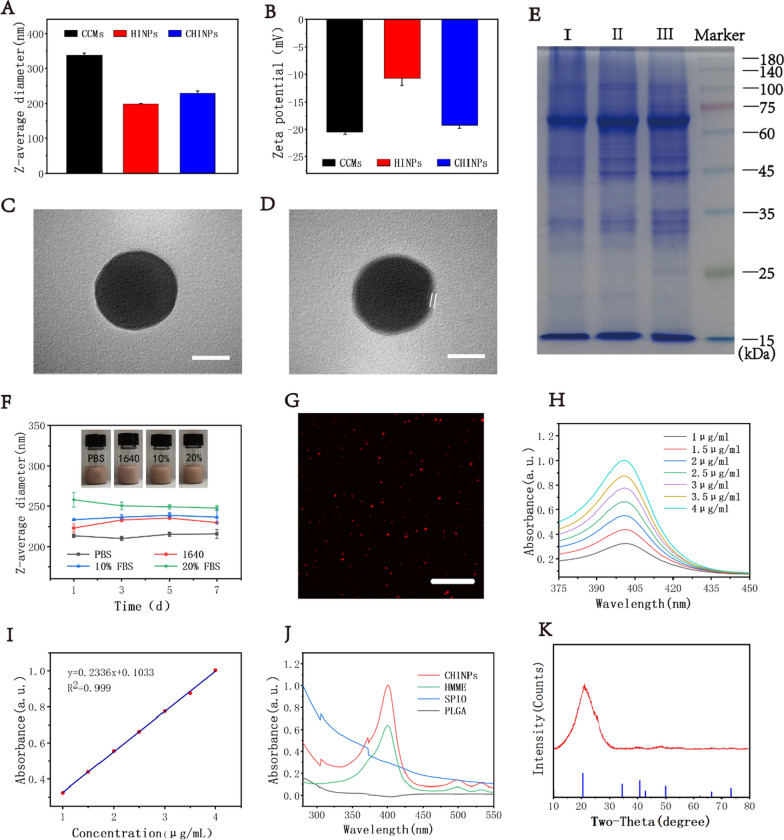
Fig. 1.
CHINPs characterization. A Z-average diameter and B zeta potentials of the CCMs, HINPs and CHINPs. C TEM image of HINPs and D CHINPs. Scale bar: 100 nm. E SDS-PAGE protein analysis of different samples. Samples were stained with Coomassie Blue. I): tumor cells lysate, II): CCMs, III): CHINPs. F The stability of CHINPs in PBS, water containing 1640 medium, 10% or 20% FBS. Inset: photographs of CHINPs after incubation in different medium. Data shown are mean ± SD (n = 3). G CLSM image of CHINPs, Scale bar: 25 µm. H UV–Vis spectrum of HMME and I Absorbance intensity of HMME at 401 nm. J UV–Vis spectrum of PLGA, HMME, SPIO and CHINPs. K XRD patterns of CHINPs

