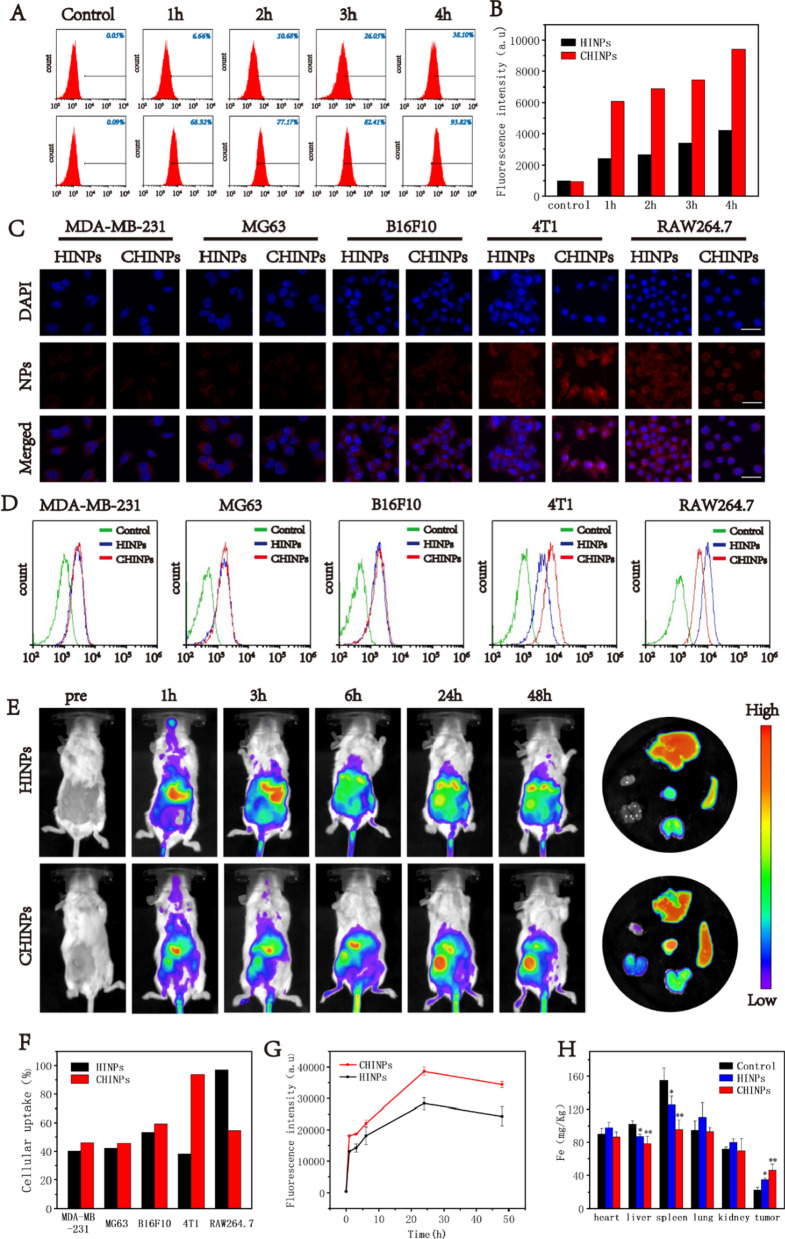
Fig. 2.
In vitro and in vivo homologous-targeted effects of CHINPs and biodistribution. A Flow cytometric profiles of 4T1 cells treated with HINPs and CHINPs and B the corresponding mean fluorescence intensity. C CLSM images of different cells treated with HINPs, CHINPs. Scale bar: 20 μm. D Flow cytometric profiles of different cells treated with HINPs, CHINPs and F the corresponding cellular uptake. E In vivo distribution of HINPs and CHINPs in 4T1 tumor-bearing Balb/c mice examined by fluorescence imaging at different time points and Ex vivo tissue distribution in the main organs: heart, liver, spleen, lung, kidney, and tumor. G The corresponding mean fluorescence intensity of tumor by in vivo fluorescence imaging. H Quantitative biodistribution of CHINPs in Balb/c mice determined by ICP-MS. Data shown are mean ± SD (n = 3). Statistical differences determined by one-way ANOVA; *p < 0.05, **p < 0.01

