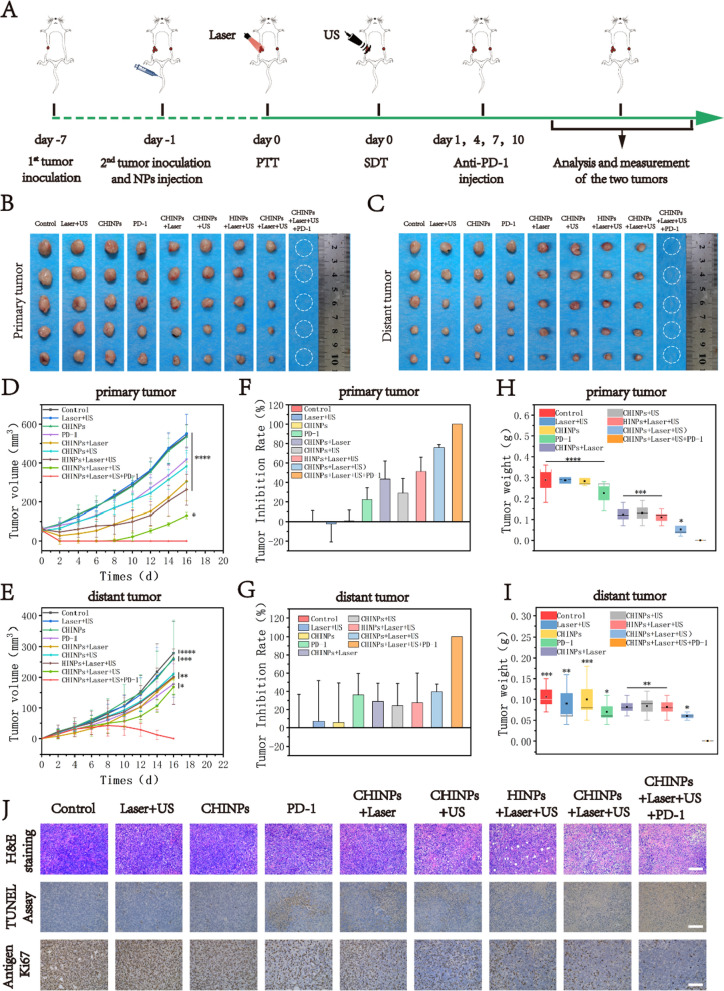
Fig. 6.
In vivo anticancer activity of PTT/SDT plus anti-PD-1 immunotherapy. A Schematic illustration of the in vivo experimental design. Tumor on the right abdomen was designated the primary tumor, and that on the left site was defined as the distant tumor to mimic metastasis. B–I Photographs of excised primary (B) and distant (C) tumors of different groups of 4T1 tumor-bearing mice after various treatments; Primary (D) and E distant tumor-growth curves of different groups; Tumor inhibition rate of primary (F) and distant (G) tumors at the end of treatments; average weights of primary (H) and distant (I) tumors at the end of treatments. Data shown are mean ± SD (n = 5), Statistical differences determined by one-way ANOVA. J H&E staining, TUNEL staining and Antigen Ki-67 immunohistochemistry staining in tumor region of each group after the treatments. Scale bar: 100 μm. Data shown are mean ± SD (n = 3). Statistical differences determined by one-way ANOVA; *p < 0.05, **p < 0.01, ***p < 0.001, **** < 0.0001

