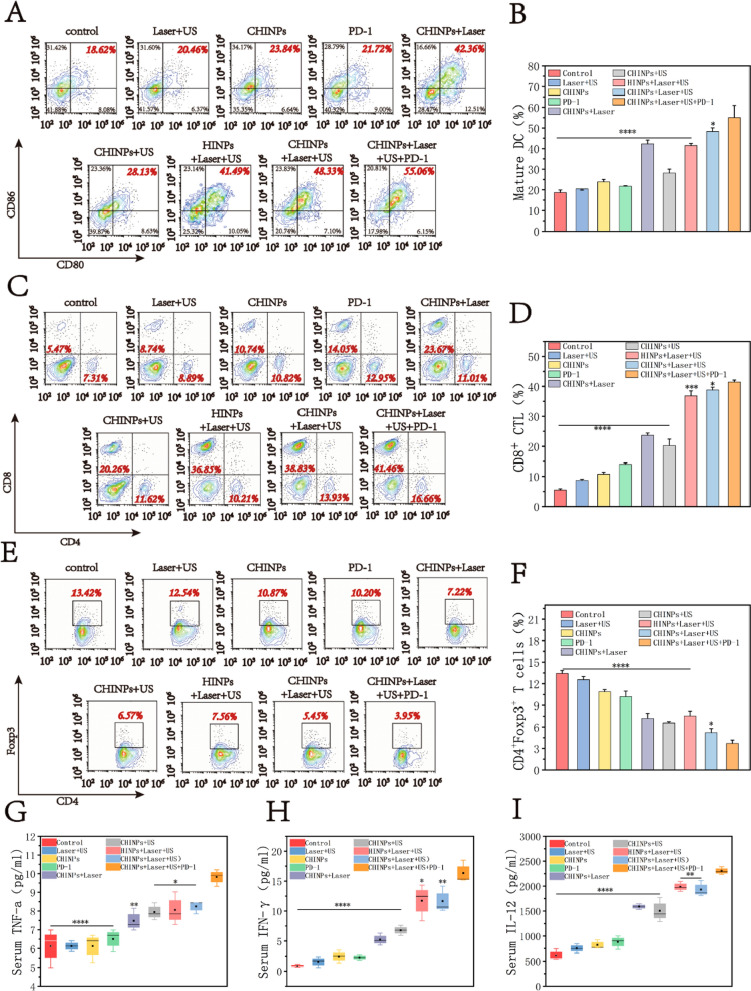
Fig. 7.
In vivo activation of immune responses triggered by PTT/SDT. A The DC maturation levels induced by CHINPs-based PTT/STT on 4T1 tumor-bearing mice (gated on CD11c+ DC cells) analyzed by flow cytometry and B the corresponding quantitative analysis. C The CD8+ T cells (CD3+CD8+) analyzed by flow cytometry and D the corresponding quantitative analysis. E The Treg cells (CD3+CD4+Foxp3+) analyzed by flow cytometry and F the corresponding quantitative analysis. G–I Cytokine levels in sera from mice isolated at 7d post different treatments. Data shown are mean ± SD (n = 3). Statistical differences determined by one-way ANOVA; *p < 0.05, **p < 0.01, ***p < 0.0001, ****p < 0.0001

