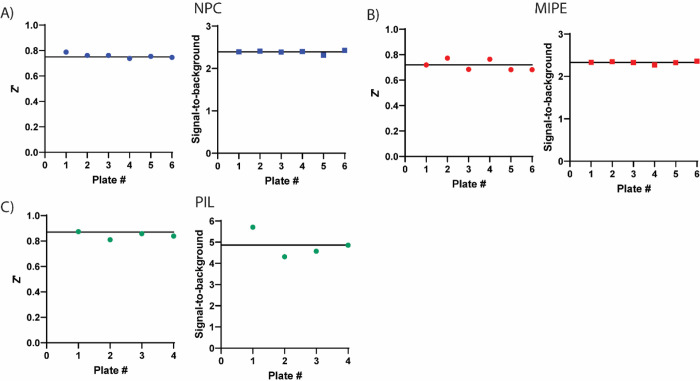
Figure 2.
Assay performance for primary screening of the compound libraries in the TMPRSS2 fluorogenic biochemical activity assay. Z’ scores and signal-to-background values are plotted as data points for each plate. There were 32 positive and 64 negative control wells on each 1536-well plate. (A) NCATS Pharmaceutical Collection (NPC), 2,678 compounds, (B) Mechanism Interrogation Plate (MIPE) library, 2,480 compounds and (C) protease inhibitor library (PIL), 872 compounds. Black horizontal lines represent the mean values.

