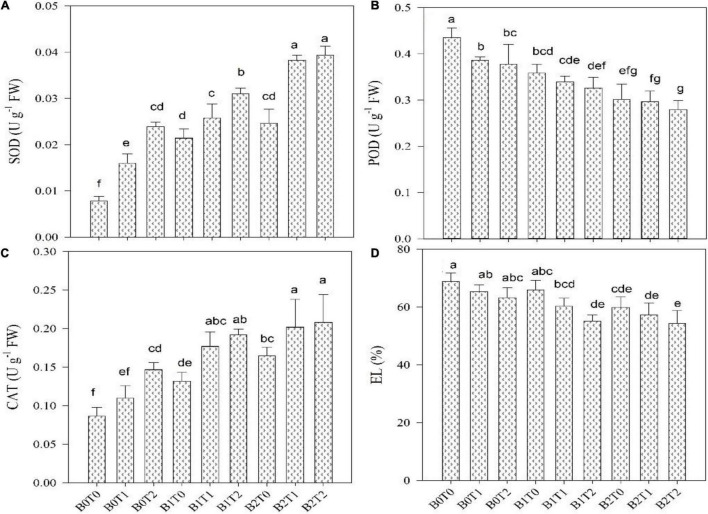
FIGURE 3.
Effect of combined application of TU and BC on (A) superoxide dismutase (SOD), (B) peroxidase (POD), (C) catalase (CAT), and (D) electrolyte leakage (EL), grown under Cd contamination. Values are averages ± SD (n = 3). Different statistical letters represent significant differences in values between treatments (p < 0.05). TU, thiourea; BC, biochar; T0 = 0 mg L–1; T1 = 600 mg L–1; T2 = 600 mg L–1; B0 = 0% w/w; B1 = 2.5% w/w; B2 = 5.0% w/w.

