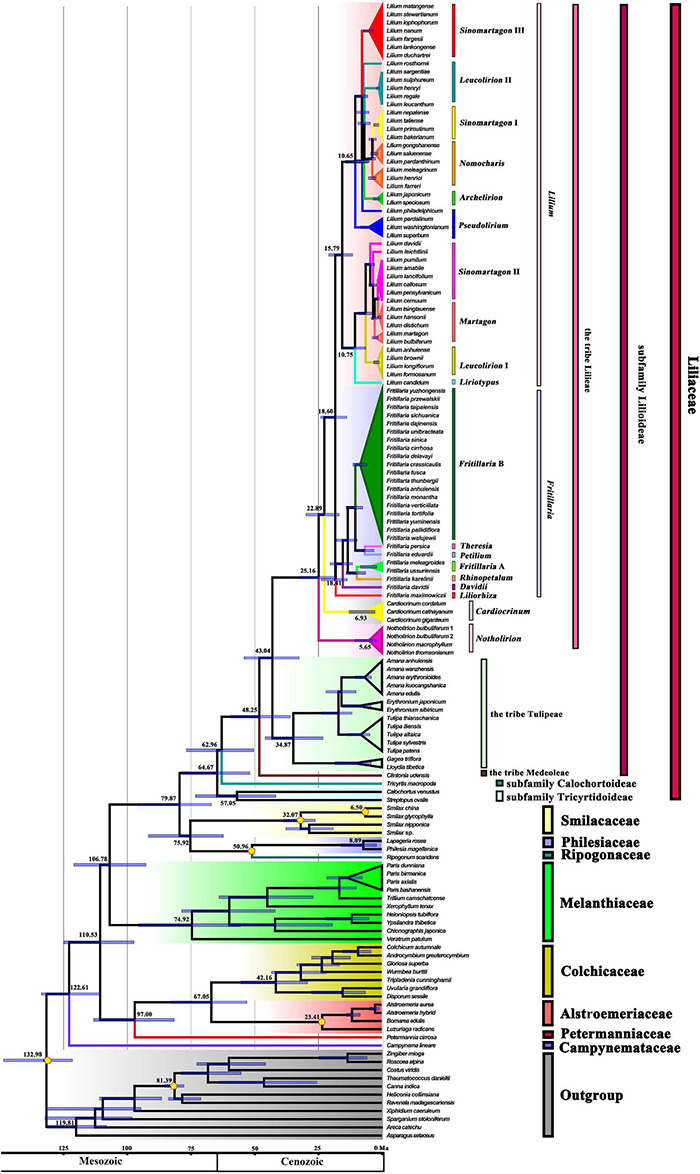
FIGURE 2.

The estimation of divergence time based on 139 plastomes of Liliales and outgroups. The 95% highest posterior density (HPD) estimates for each well-supported clade are represented by bars. The APG (2016) classification is indicated to the right of the tree and colored within the tree. Yellow pentagons indicate six calibration points (see text).
