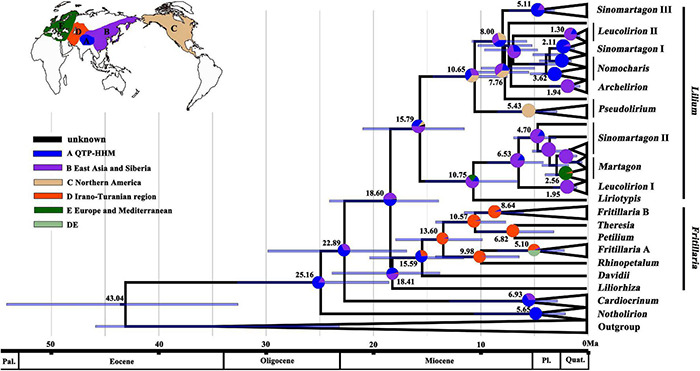
FIGURE 3.

Reconstructions of the ancestral area based on plastome-based phylogeny of Lilieae (see Figure 1A). Pie charts show proportions of inferred ancestral ranges, pie slice colors to regions defined in the caption and inset world map. Mean divergence ages are given on nodes (see Figure 2). Bars on nodes indicate the 95% HPD of divergence ages.
