Figure 6:

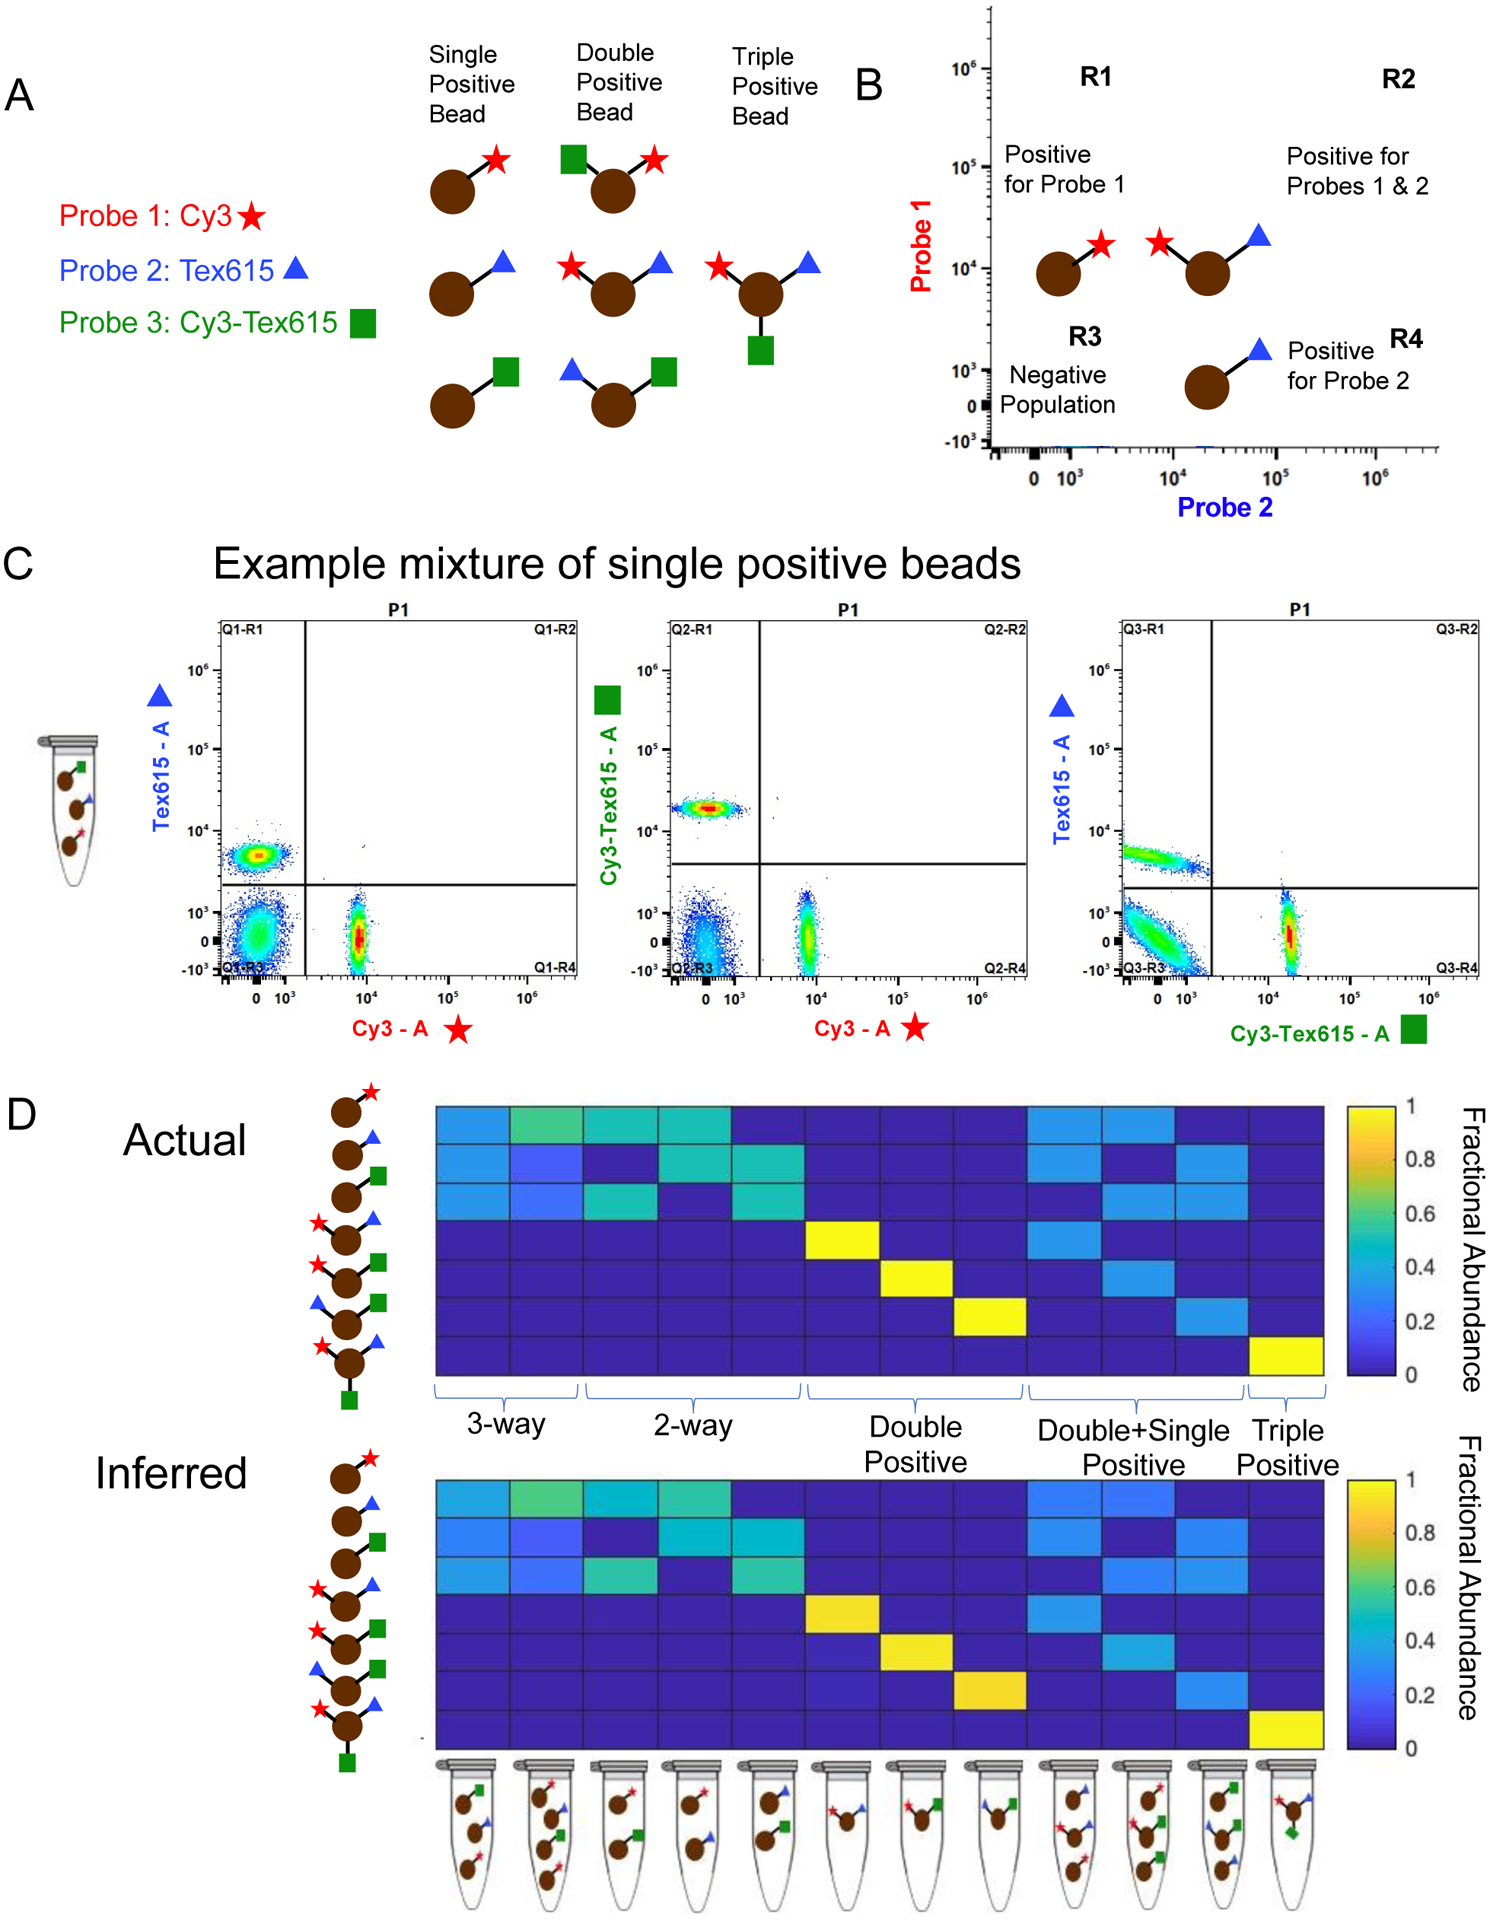
Spectral flow cytometry setup and results. (A) Experimental setup for the three-probe mixture ((1) Cy3 (red star), (2) Tex615 (blue triangle), and (3) Cy3-Tex615 (green square)) using single positive, double positive, and triple positive beads (brown circles). (B) Gating strategy for the populations of beads in the three-probe mixture. (C) Unmixing populations of single-labeled beads in a three-way equimolar mixture of probes Cy3, Tex615, and Cy3-Tex615 using spectral flow cytometry. The plots show unmixing results of Tex615 compared to Cy3 (left), Cy3-Tex615 compared to Cy3 (middle), and Tex615 compared to Cy3-Tex615 (right). (D) Comparing actual amounts of each probe in the mixture (top panel) to the inferred or calculated amounts of each probe in the mixture (bottom panel). The composition of each mixture is shown below the bottom panel.
