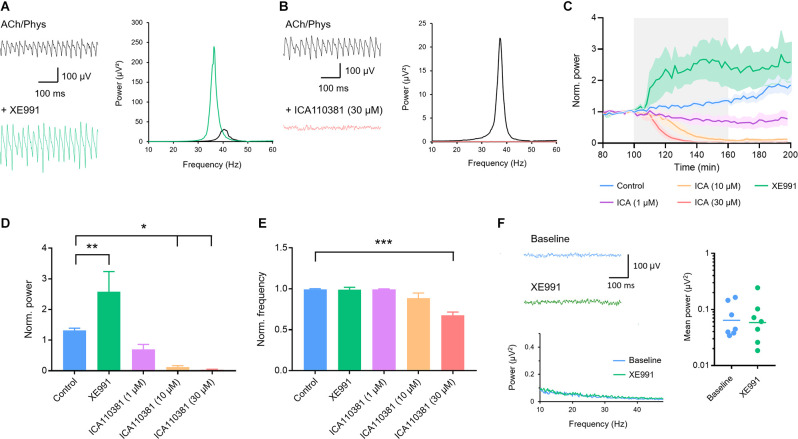
Figure 2.
Involvement of voltage-gated Kv7.2/3 (KCNQ2/3) channels in the modulation of hippocampal gamma oscillations. (A) Original traces (left) and power spectra (right) of cholinergically induced gamma oscillations before (black) and after (green) bath application of the KCNQ2/3 blocker XE991 (10 μM). (B) Original traces (left) and power spectra (right) of cholinergically induced gamma oscillations before (black) and after (red) bath application of the KCNQ2/3 positive allosteric modulator ICA110381 (30 μM). (C) Normalized gamma power before, during and after the application of XE991 (10 μM, green) and increasing concentrations of ICA110381 (1 μM; purple; 10 μM; orange; 30 μM red) compared to control (blue). The application of the drugs is highlighted in gray. (D) Effect of XE991 and ICA110381 on the normalized peak power of hippocampal gamma oscillations compared to control. Control (blue): n = 13 slices, N = 9 animals; XE991 (green): n = 9, N = 4, p = 0.009; ICA110381 1 μM: (purple): n = 8, N = 5, p = 0.381; 10 μM (orange): n = 8, N = 4, p = 0.019; 30 μM (red): n = 8, N = 4, p = 0.011. (E) Effect of XE991 and ICA110381 on the normalized peak frequency of hippocampal gamma oscillations compared to control. XE991 (green): p > 0.999; ICA110381 1 μM (purple): p > 0.999; 10 μM (orange): p = 0.073; 30 μM (red): p < 0.001. (F) Left, top: original traces of local field potentials (LFPs) before and after the application of XE991. Left, bottom: power spectra of LFPs before and after XE991 application. Right: scatter plot comparing the mean absolute power between 10 and 50 Hz before (baseline; blue) and after application of XE991 (green, n = 7, p = 0.825, bars show geometric mean). Recording temperature was between 34 and 36°C. Traces were lowpass filtered at 200 Hz and bandstop-filtered at 50 Hz. Bars show mean ± SEM. *p < 0.05, **p < 0.01, ***p < 0.001. ACh, acetylcholine; Phys, physostigmine.

