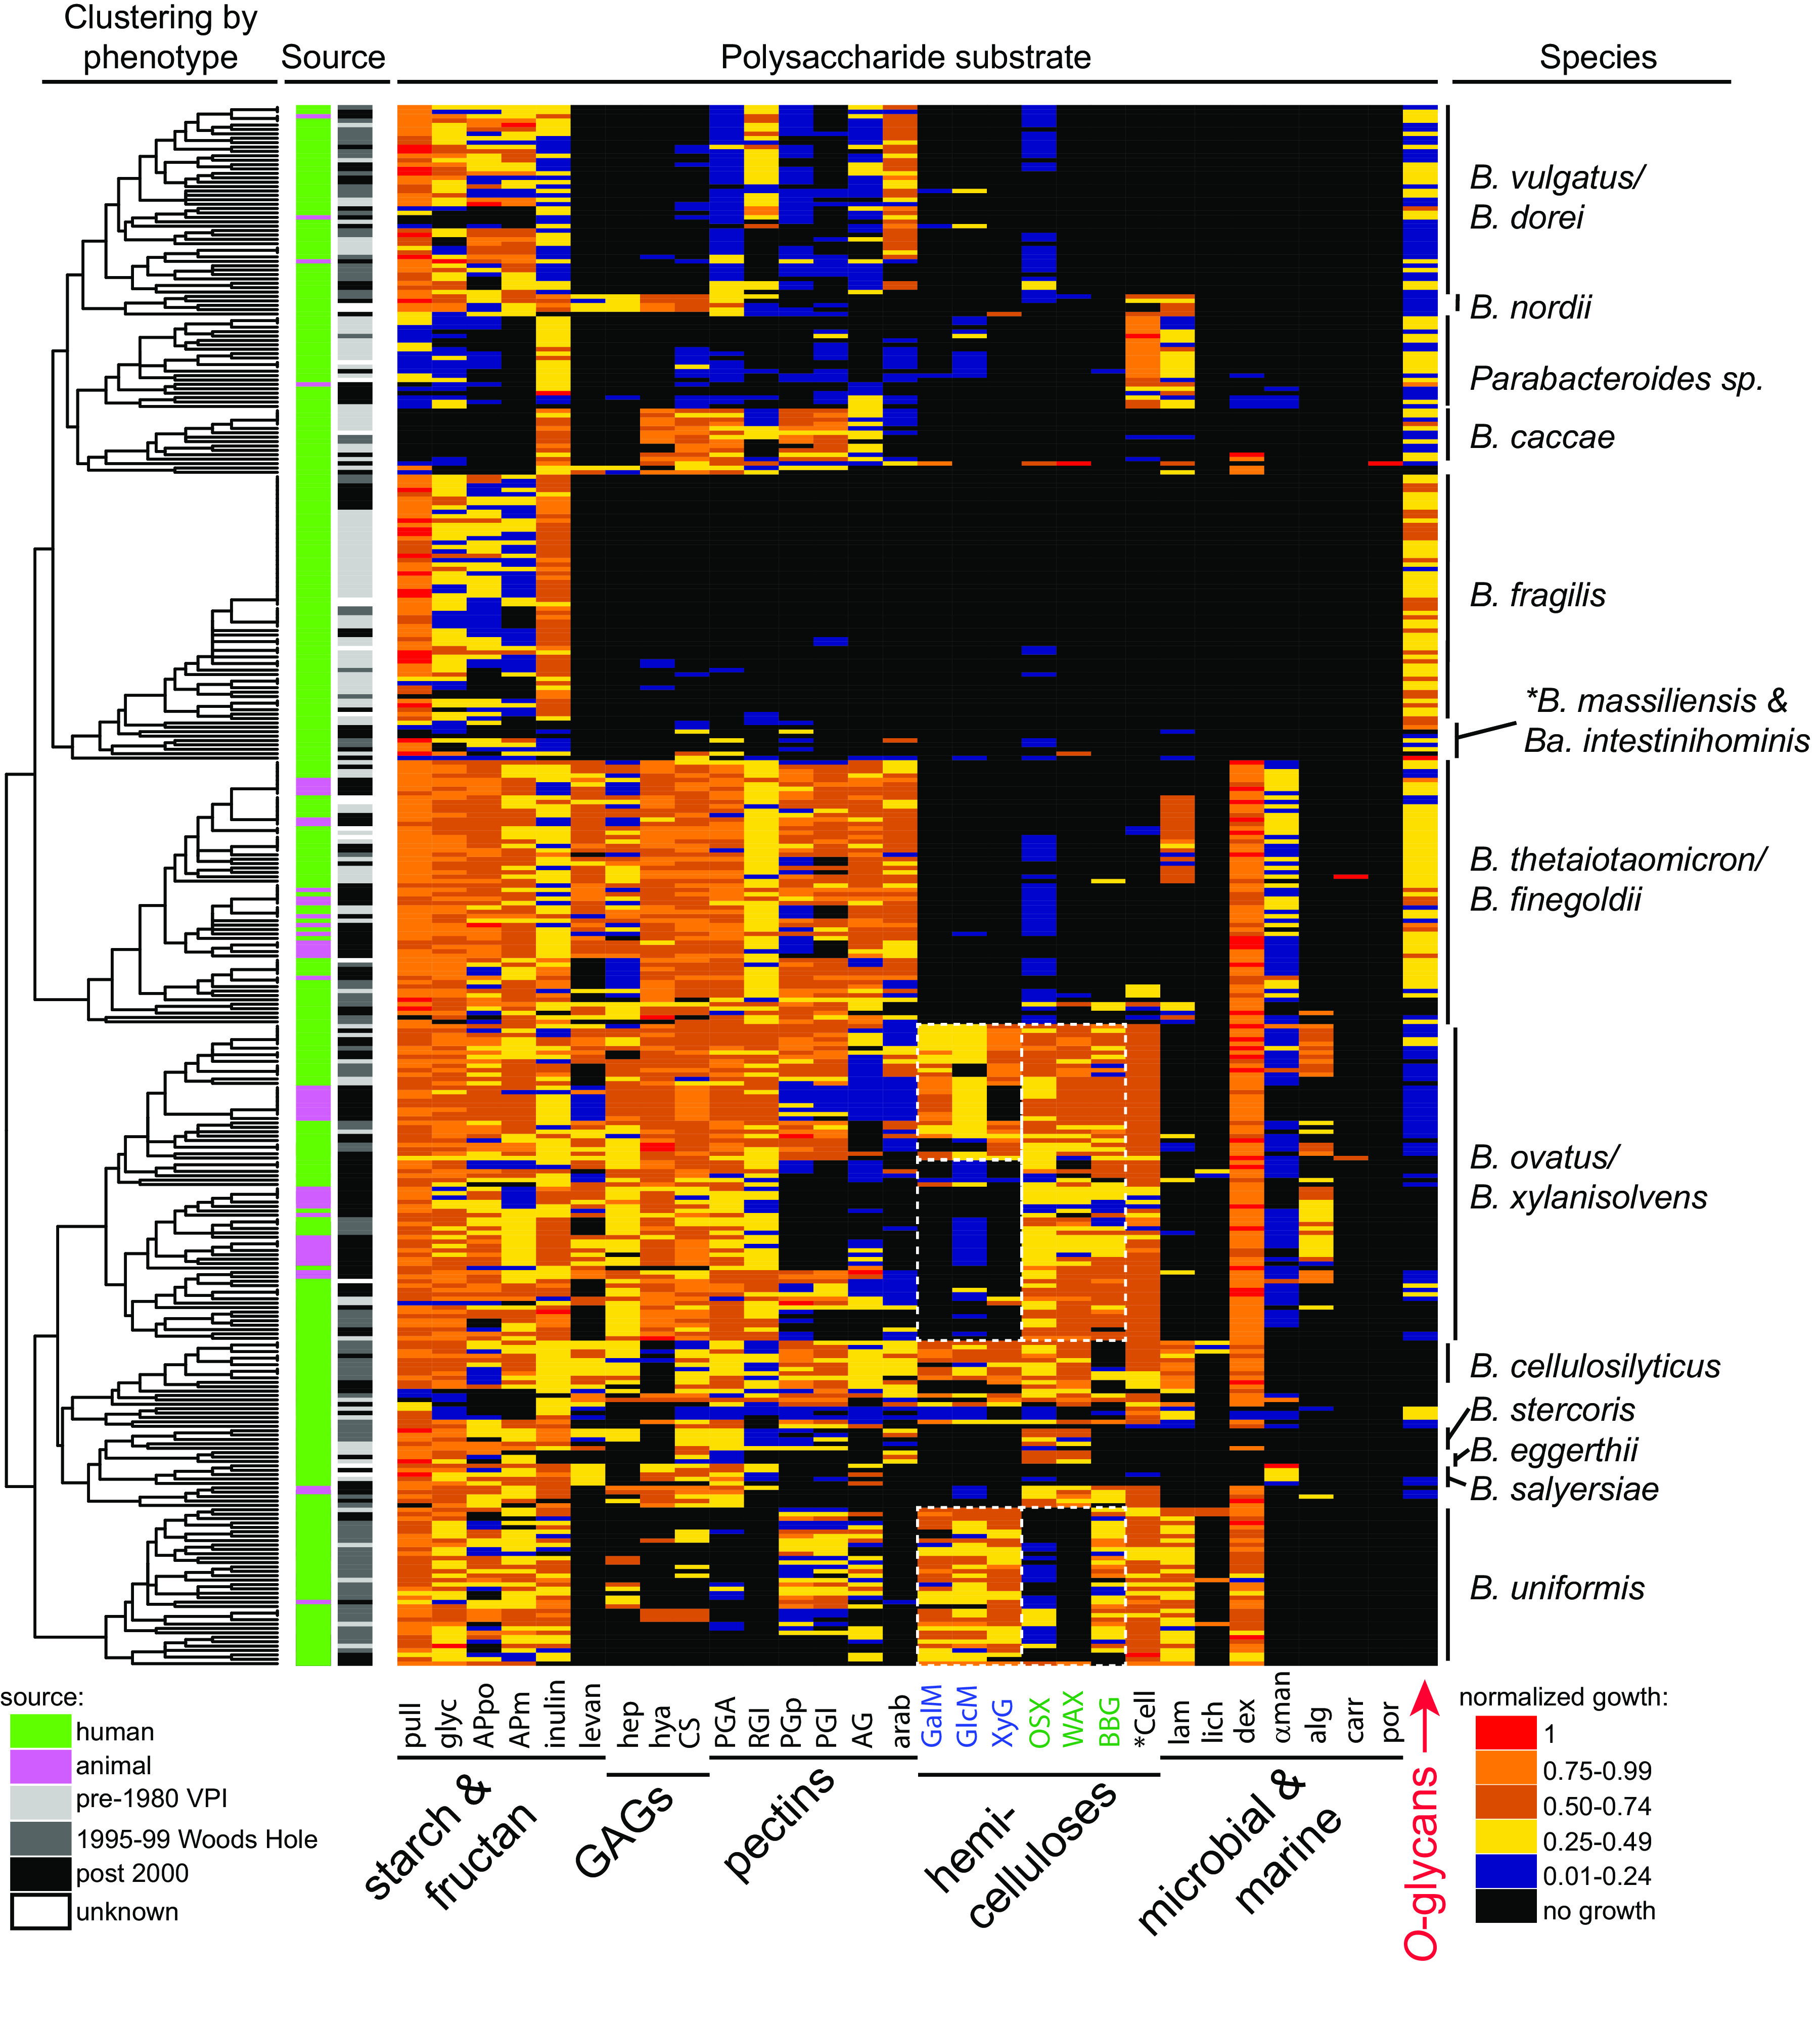
FIG 2.

Heatmap of individual polysaccharide utilization traits. Species are clustered by glycan utilization phenotype based on normalized total growth level (Fig. S4B). The magnitude of growth is indicated by the heatmap scale at the bottom right. Columns at the left indicate the source (human or animal) and time period of isolation. The cladogram at the far left shows the results of unsupervised clustering of the data based on the normalized growth data shown. The species designations at the right are the results of 16S rRNA gene sequencing (>98% identity to the species type strain was used to assign species). The region containing mucin specialists B. massiliensis and B. intestinihominis is indicated but marked with an asterisk because the 4 strains in these 2 species are not clustered perfectly in this region. All raw and normalized growth and rate data for individual strains may be found in Table S1. See Fig. S3 for an expanded heatmap with monosaccharide data and individual strain names labeled. All processed growth curves are available as source data.
