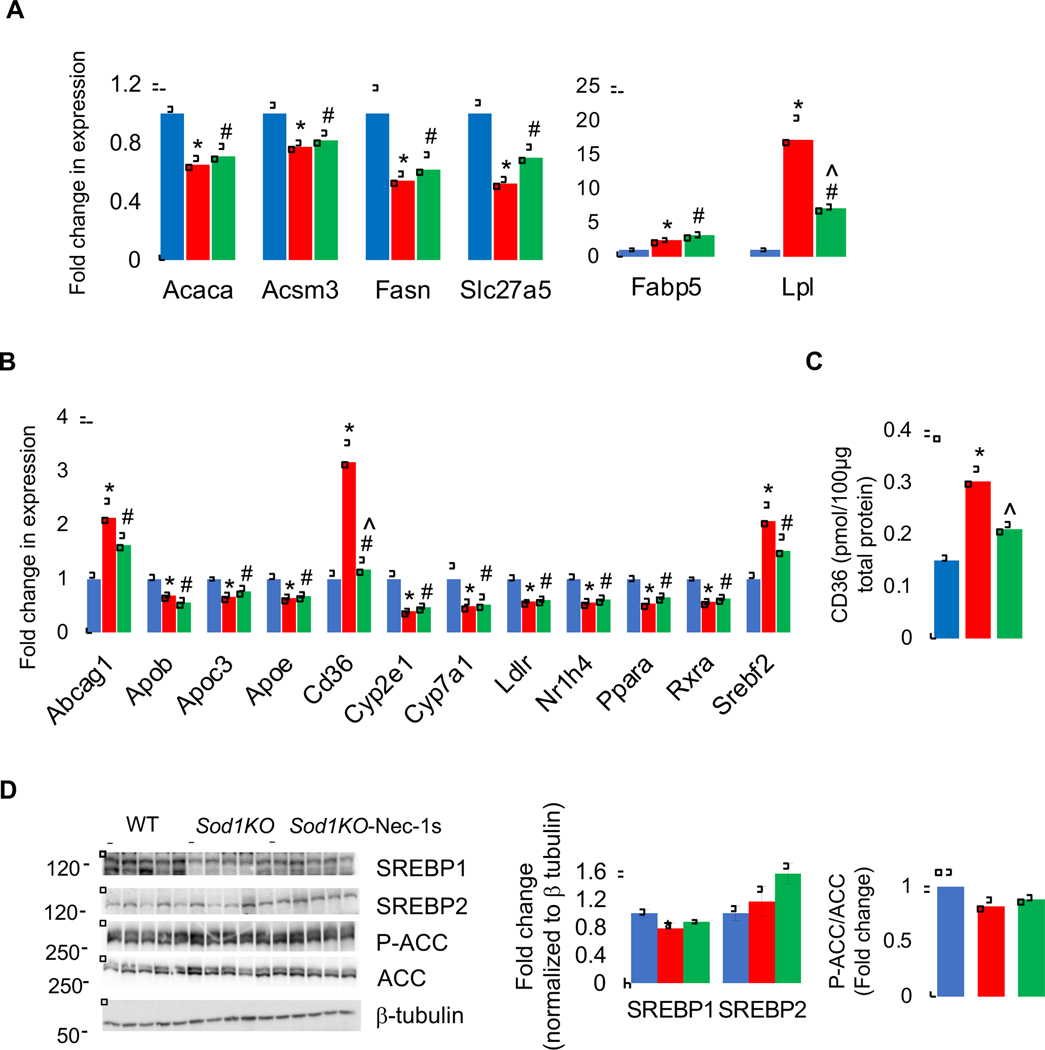
Figure 5. Effect of Sod1 deficiency and necroptosis on lipid metabolism.
Transcript levels of proteins involved lipid metabolism and transport (A) and cholesterol metabolism and transport (B) in the livers Sod1KO mice (red bars) and Sod1KO mice treated with Nec-1s (green bars), compared to WT mice. (C) Protein expression of as assessed by targeted quantitative proteomics. (D) Left panel: Immunoblots of liver extracts for SREBP1, SREBP2, P-ACC, ACC, and β-tubulin. Right panel: Graphical representation of SREBP1 and SREBP2 blots normalized to β-tubulin and P-ACC normalized to ACC. (ANOVA, *WT-Veh vs Sod1KO-Veh; #WT-Veh vs Sod1KO-Nec-1s; ^ Sod1KO-Veh vs Sod1KO-Nec-1s; */#/^ P ≤ 0.05).

