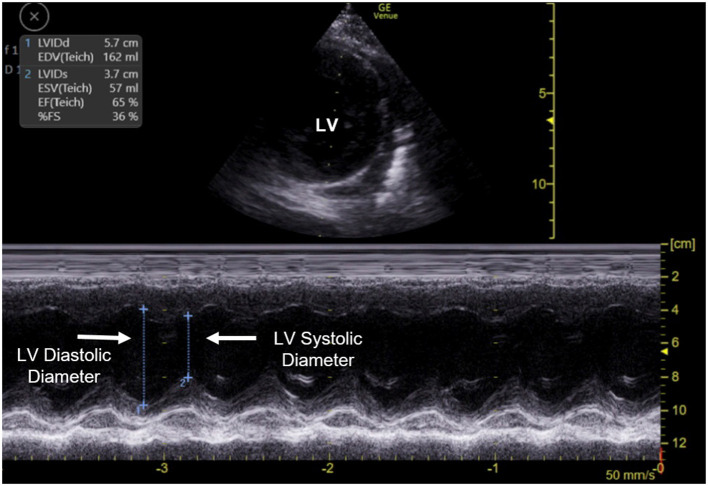
Figure 2.
Quantitative estimation of left ventricle (LV) function using fractional shortening. The upper half of the image displays the placement of M-mode line through the left ventricle in a parasternal short axis view of the heart. The lower half of the image displays the M-mode output. Left ventricle systolic and diastolic diameters are measured to calculate fractional shortening. The scale represents the depth of imaging. LV, Left ventricle.

