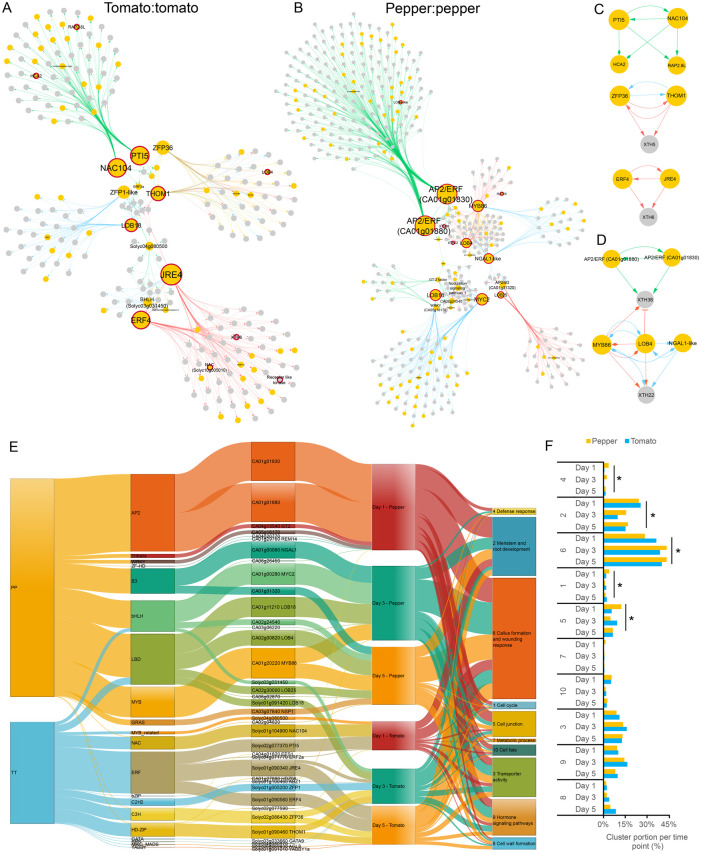
Figure 3.
Time-specific modules and their major regulators identified in tomato:tomato and pepper:pepper self-graft gene regulatory networks. A and B, Causal relations were predicted with a dynamic Bayesian network approach between differentially expressed transcription factors and DEGs associated with GO categories related to grafting for the (A) tomato:tomato self-graft and (B) pepper:pepper self-graft. Green, blue, red, and yellow arrows represent regulations at 1 DAG, 3 DAG, 5 DAG, and 3 and 5 DAG, respectively. Yellow and gray nodes represent transcription factors and non-transcription factors, respectively. Red bordered nodes are discussed in the main text. C and D, Highlighted inferred interactions in the main text from the tomato:tomato (C) and pepper:pepper (D) networks. (E) Sankey diagram visualizing inferred gene regulatory interactions from the tomato:tomato and pepper:pepper networks. The width of the connections between each vertical block represents the number of genes (from left to right): contained within each graft combination network, within each TF family, downstream of the major hub, expressed at a specific time point, and that fall into a specific GO cluster. All TFs that have an outdegree >0 are included. F, Percentage of the downstream target genes associated with each GO cluster per time point. * = P < 0.05 (Fisher’s exact test).

