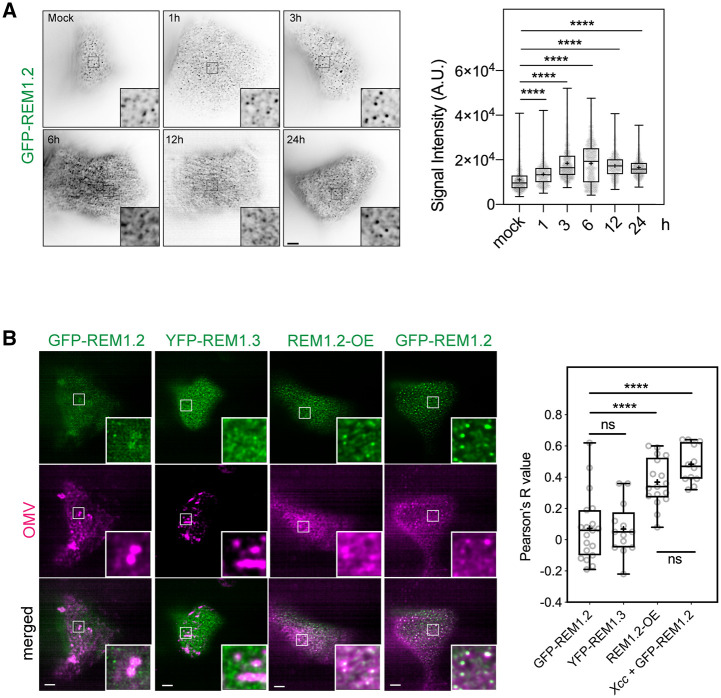
Figure 3.
Colocalization of remorins with FM4–64-labelled OMVs. A, Time-dependent increment of GFP-REM1.2 intensity on Arabidopsis PM after flooding inoculation with Xcc. Seven-day-old pREM1.2:GFP-REM1.2 seedlings were flooded with 1 × 10⁷ CFU·mL−1 bacterial suspension before TIRFM imaging at the indicated times post-inoculation. Images of GFP-REM1.2 foci were acquired by VA-TIRFM using a Zeiss LSM780 + ELYRA microscope, equipped with a 100× oil objective (NA = 1.46, bar, 5 µm). B, VA-TIRF dual imaging of the colocalization of GFP-REM1.2, YFP-REM1.3, GFP-REM1.2 in the XVE:GFP-REM1.2 seedlings (REM1.2-OE) and under infection condition (flooded with Xcc 8004 and incubated for 6 h) with FM4–64-labeled OMVs. VA-TIRF dual-color images were acquired by a Zeiss LSM780 + ELYRA microscope equipped with a 100× oil-objective lens. XVE:GFP-REM1.2 seedlings were induced with 5-µM β-estradiol for 24 h prior to imaging (bar, 5 µm). Violin plot shows Person’s R values, representing the colocalization between remorins and FM4–64 labeled OMVs. The differences between treatments were determined by one-way ANOVA (ns, not significant, *P≤0.05; **P≤0.01, ***P≤0.001, ****P≤0.0001).

