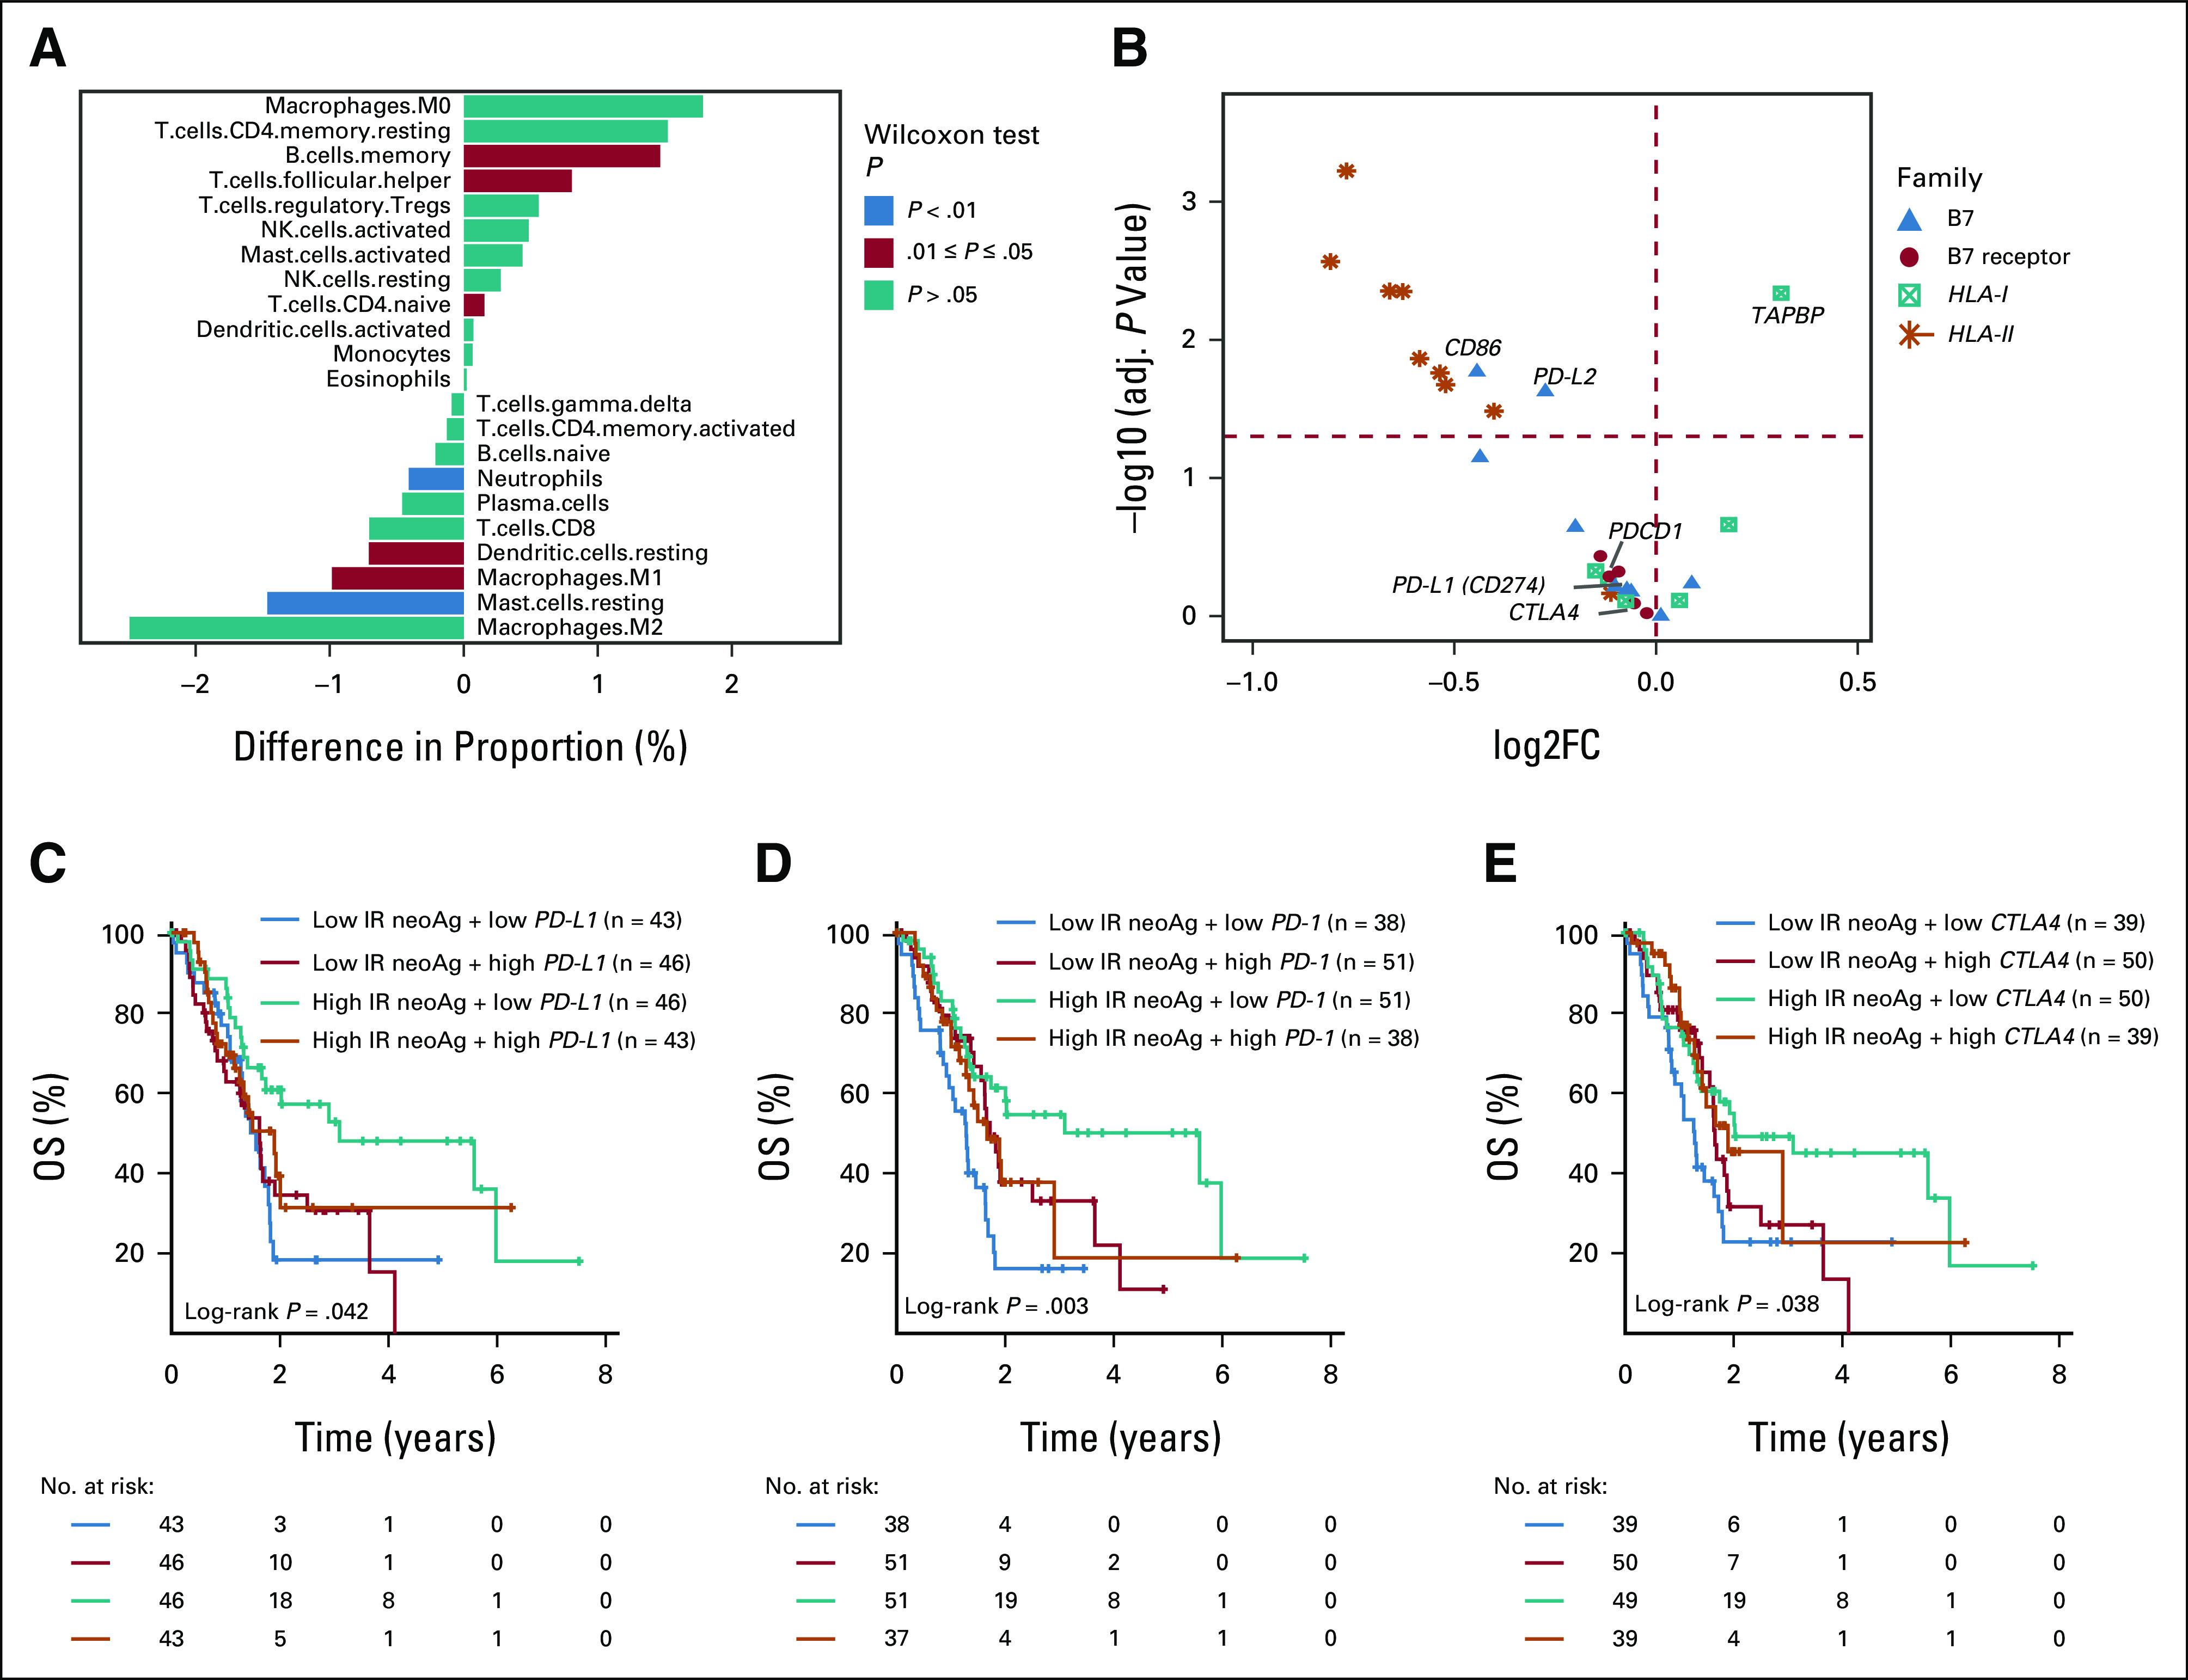
FIG 2.

IR-neoAg load is associated with immune features in the TCGA-PAAD cohort. (A) Comparison of the percentage of tumor-infiltrated immune cells between tumors with high and low IR-neoAg load. A positive value along the x-axis represents a higher and a negative value represents a lower proportion of cells in the high IR-neoAg samples. P values were calculated using the Mann-Whitney-Wilcoxon test. (B) Volcano plot showing the expression differences of immune-related genes between the high and low IR-neoAg load tumors. Symbols to the right of the vertical dashed line represent genes with higher expression and symbols on the left represent genes with lower expression in high IR-neoAg tumors. Symbols above the red dashed line represent genes with adjusted P-values < .05. Kaplan-Meier overall survival curves for four patient groups stratified by IR-neoAg load and the gene expression levels of (C) PD-L1, (D) PD-1, and (E) CTLA-4. A risk table is displayed below the plot. CTLA-4, cytotoxic T-lymphocyte antigen 4; IR-neoAg, intron-retention neoantigens; OS, overall survival; PD-1, programmed cell death protein 1; PD-L1, programmed cell death ligand 1.
