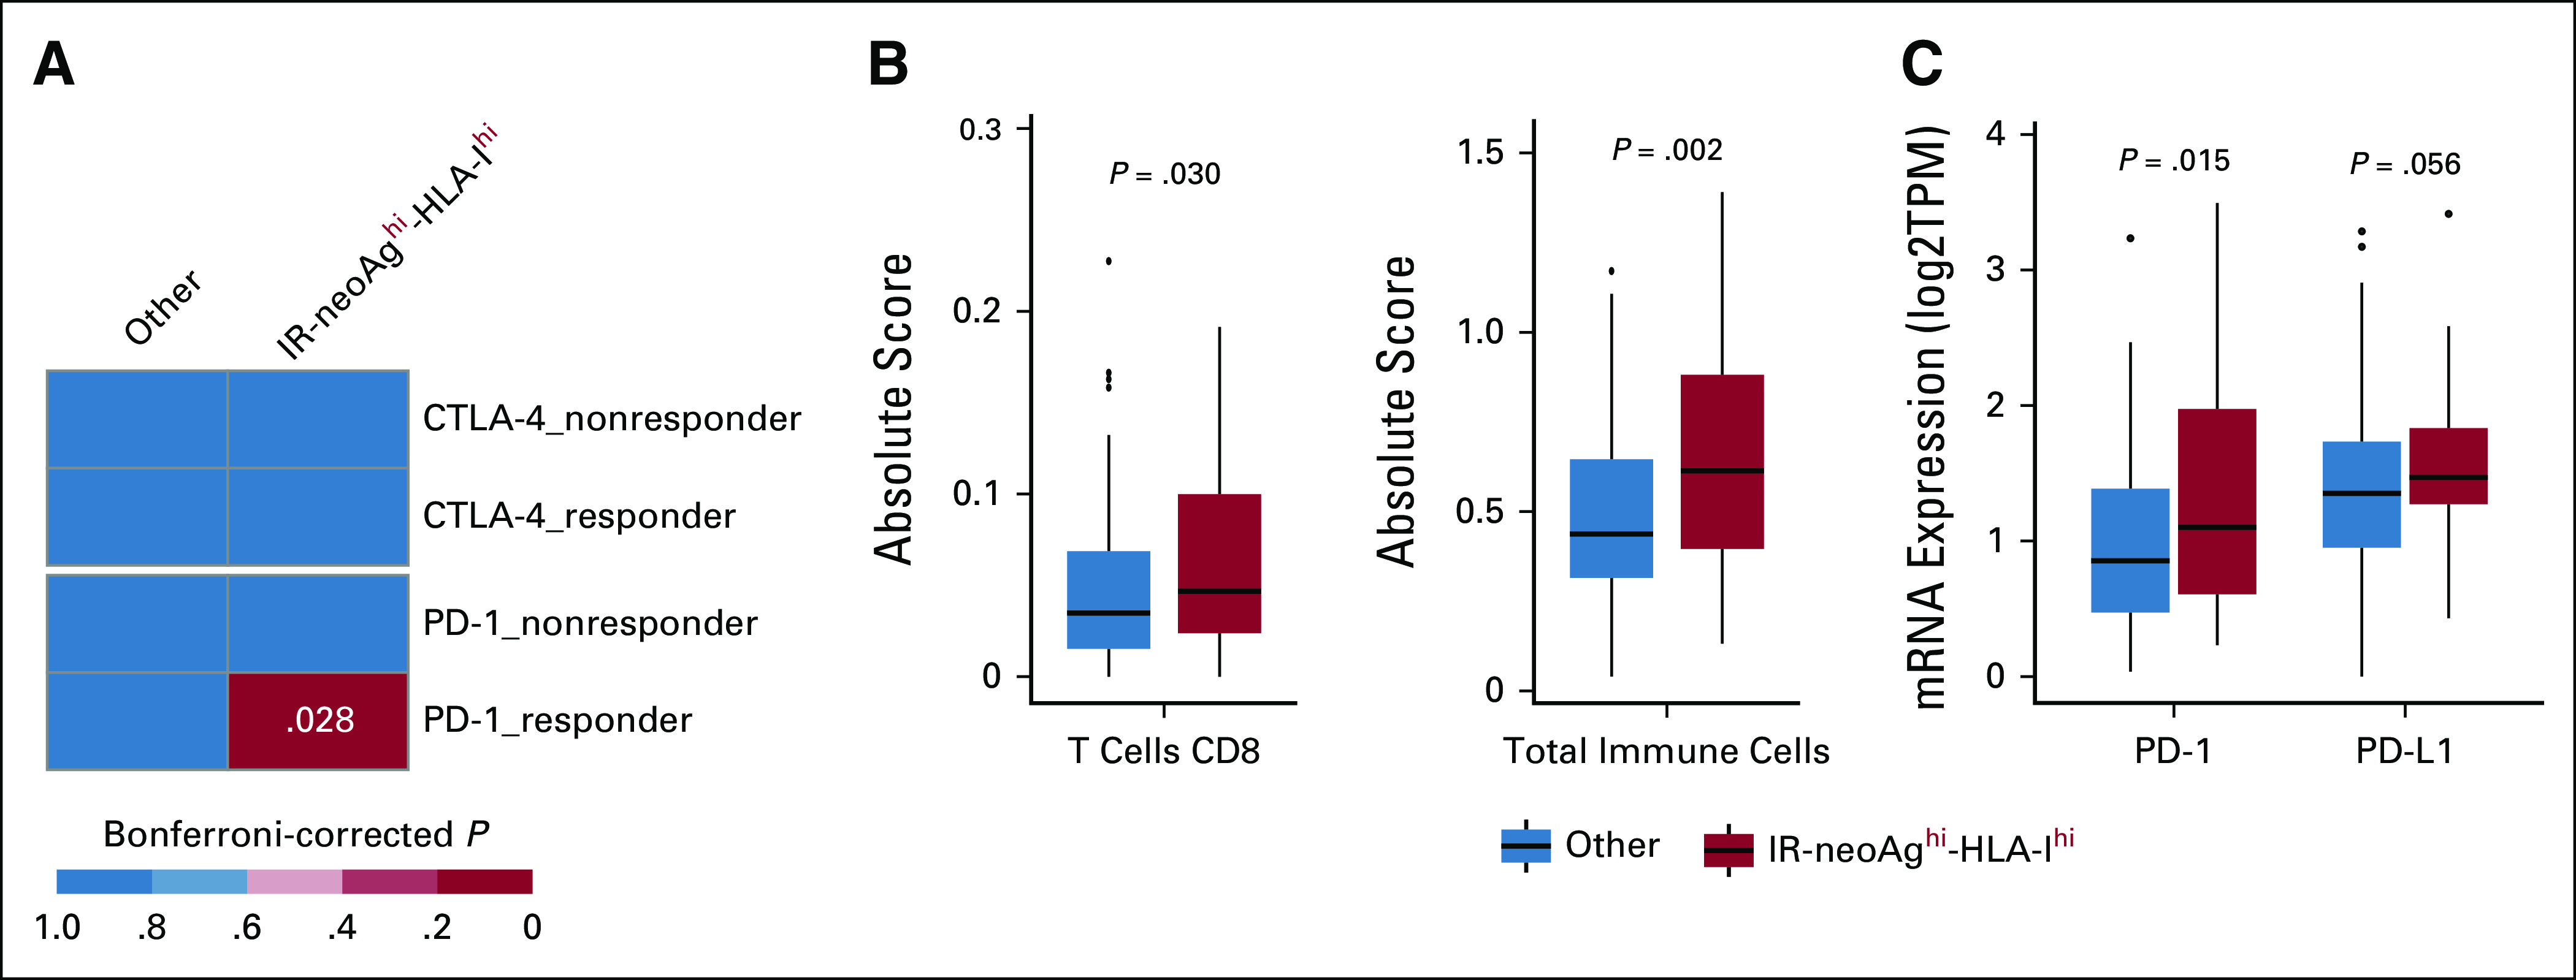
FIG 3.

High IR-neoAg and high HLA class-I expression identify pancreatic cancers with similarities to tumors responsive to immune checkpoint blockade therapy. (A) Submap analysis comparing two groups from the TCGA-PAAD cohort (IR-neoAghi-HLA-Ihi [n = 43], and all Others [n = 135]) and four groups from an ICB-treated melanoma patient data set (anti–PD-1 responders [n = 12], anti–PD-1 nonresponders [n = 14], anti–CTLA-4 responders [n = 8], and anti–CTLA-4 nonresponders [n = 28]). Bonferroni-corrected P values were calculated in the SubMap program. (B) Box plot representation of the proportion of CD8+ T cells and total tumor-infiltrated immune cells between tumors with IR-neoAghi-HLA-Ihi and all other tumors in the TCGA-PAAD data set. Absolute score is estimated as the median expression level of all genes in the signature matrix divided by the median expression level of all genes in the mixture and is used to scale the relative cell fractions to absolute abundances. (C) Box plot representation of the tumor expression levels of immune checkpoint genes (PD-1 and PD-L1) in TCGA-PAAD tumors with IR-neoAghi-HLA-Ihi and all others. Box plots represent median and IQR. Upper whisker extends to the third quartile plus 1.5× IQR. Lower whisker extends to the first quartile minus 1.5× IQR. P values were determined using Wilcoxon test. CTLA-4, cytotoxic T-lymphocyte antigen 4; IQR, interquartile range; IR-neoAg, intron-retention neoantigens; mRNA, messenger RNA; PD-1, programmed cell death protein 1; PD-L1, programmed cell death ligand 1; TPM, transcripts per million.
