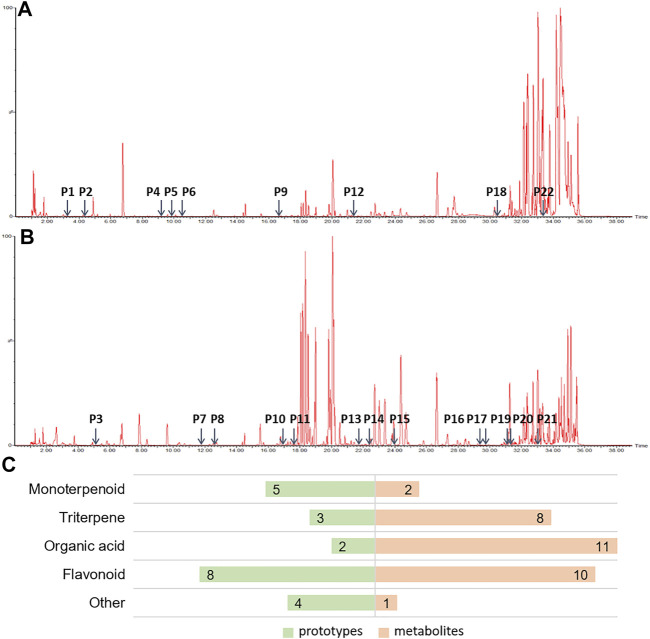
FIGURE 3.
The prototypes and their metabolites in the plasma of rats after intragastric administration of HHXYT. Total ion chromatograms of rat plasma samples after intragastric administration of HHXYT and the distribution of 22 prototypes, positive mode (A) and negative mode (B). (C) Categories of prototypes and metabolites.

