FIGURE 5.
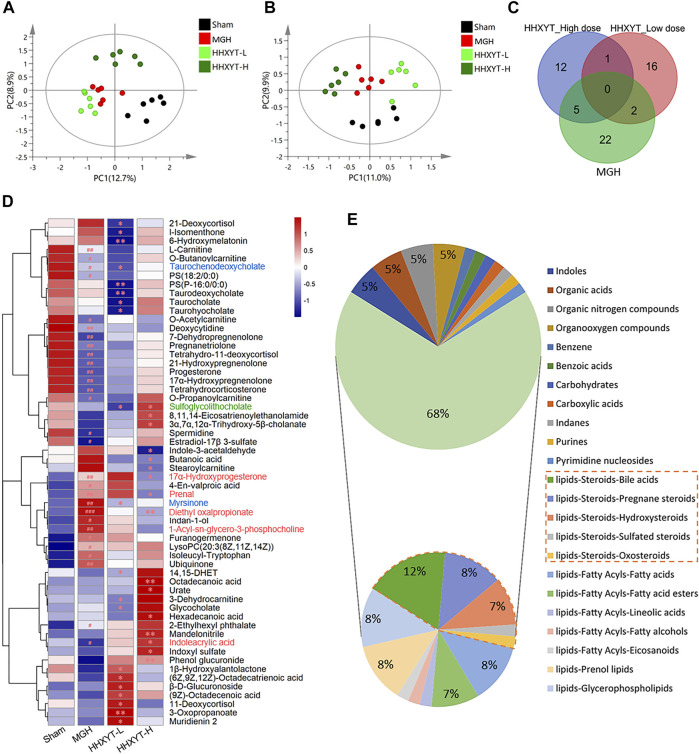
Endogenous differential metabolites were identified from the metabolomics experiment. PLS-DA score plots of Sham, MGH HHXYT-L, and HHXYT-H, in positive mode (A) and negative mode (B). (C) The intersection of endogenous differential metabolites in the 3 groups. (D) Heatmap of 58 endogenous differential metabolites. n = 6, #p < 0.05, ##p < 0.01, compared to Sham; *p < 0.05, **p < 0.01, compared to MGH. The red compound name means the common differential metabolites between HHXYT-H and MGH; Blue: the common differential metabolites of HHXYT-L/MGH; Green: the common differential metabolites of HHXYT-H/HHXYT-L. (E) Categories of endogenous differential metabolites. 31% of steroids were marked with the orange border.

