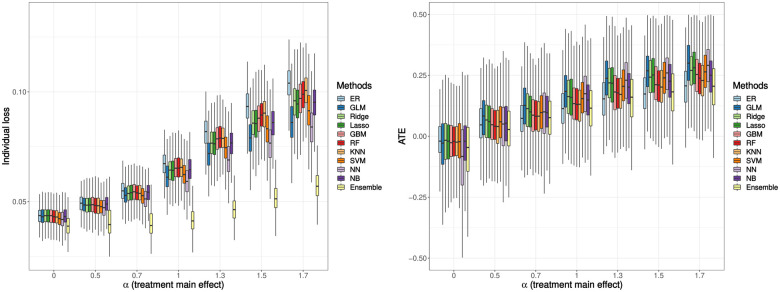
Figure 3.
Simulation result: individual loss (left), average treatment effect (ATE, right). The treatment-biomarker interaction, is fixed at 0.5. Boxplots display the median (middle line), the interquartile range (hinges), and 1.5 times the interquartile range (lower and upper whiskers) based on 1000 times simulation. The mean (over 1000 simulations) individual loss ranges from 0.04 to 0.10, and the mean ATE ranges from -0.12 to 0.30.

