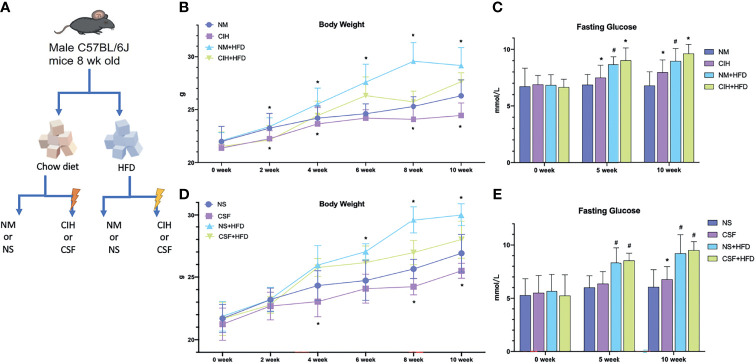
Figure 1.
Overall modeling workflow and baseline data. (A) CIH and CSF with diet intervention modeling workflow and design. (B) Body weights of the chow diet and HFD groups throughout the experiment of CIH exposure. (C) The fasting blood glucose levels of the mice in the chow diet and HFD groups during the period of CIH. (D) Body weights of the chow diet and HFD groups throughout the experiment of CSF exposure. (E) The fasting blood glucose levels of the mice in the chow diet and HFD groups during the period of CSF. Data are expressed as mean ± SEM. Group differences were assessed by using the Mann‐Whitney U test. *P < 0.05 when comparing NM/NS and CIH/CSF groups (NM/NS group vs CIH/CSF group, NM+HFD/NS+HFD group vs CIH+HFD/CSF+HFD group). #P < 0.05 when comparing chow diet and HFD groups (NM/NS group vs NM+HFD/NS+HFD group).

