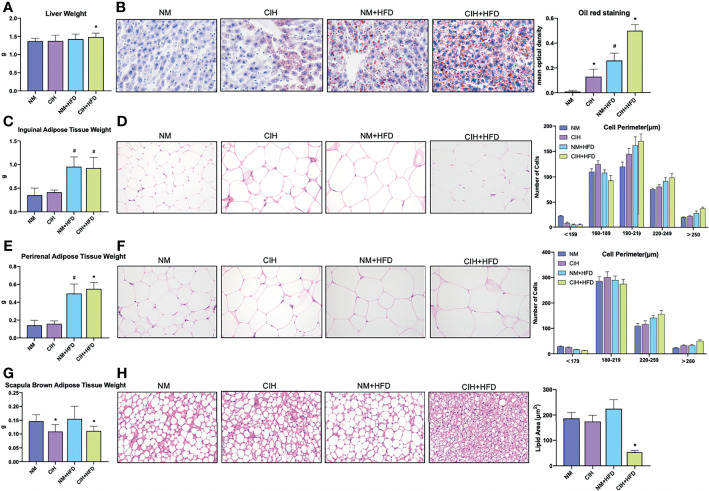
Figure 2.
Profiles of liver tissue, abdominal subcutaneous and visceral white adipose tissue, and scapula brown adipose tissue of mice exposed to CIH intervention. (A) Liver weights of the mice in the chow diet and HFD groups pre- and post- CIH. (B) Oil red staining of liver tissue and mean optical density of the mice in the chow diet and HFD groups pre- and post- CIH. (C) Inguinal adipose tissue (Abdominal subcutaneous white adipose tissue) weights of the mice in the normal and HFD groups before and after CIH. (D) Hematoxylin-eosin staining and the distribution of adipocyte perimeters of inguinal adipose tissue of the chow diet-fed and HFD-fed mice before and after CIH. (E) Perirenal adipose tissue (abdominal visceral white adipose tissue) weights of the mice in the chow diet and HFD groups pre- and post- CIH. (F) Hematoxylin-eosin staining and the distribution of adipocyte perimeters of perirenal adipose tissue of the mice and brown fat weight of the chow diet-fed and HFD-fed mice before and after CIH. (G) Scapula brown adipose tissue weights of the mice in the chow diet and HFD groups pre- and post- CIH. (H) Hematoxylin-eosin staining and lipid area of scapula brown adipose tissue of the mice in the chow diet and HFD groups pre- and post- CIH. Data are expressed as mean ± SEM. Group differences were assessed by using the Mann‐Whitney U test. *P < 0.05 when comparing NM and CIH groups (NM group vs CIH group, NM+HFD group vs CIH+HFD group). #P < 0.05 when comparing chow diet and HFD groups (NM group vs NM+HFD group). Original magnification: 400 ×.

