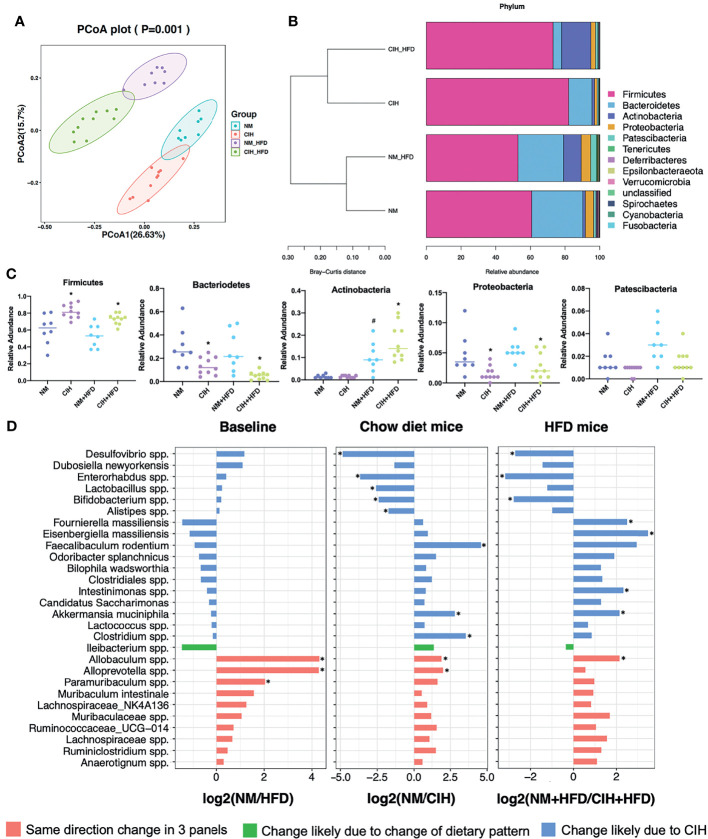
Figure 4.
Effects of CIH on fecal microbiota. (A) PCoA plot generated by using microbiota OTU metrics based on the Bray‐Curtis similarity for the NM, CIH, NM+HFD, CIH+HFD groups (n = 8-10/group). (B) The hierarchical cluster based on the Bray‐Curtis similarity of the samples from the NM, CIH, NM+HFD, CIH+HFD groups. The bar plot shows the abundance of each phylum in each sample. (C) The 5 most abundant phyla in the NM, CIH, NM+HFD, CIH+HFD groups. Data are expressed as mean ± SEM. Group differences were assessed by using the Mann‐Whitney U test. *P < 0.05 when comparing NM vs CIH, or NM+HFD vs CIH+HFD, #P < 0.05 when comparing NM vs NM+HFD. (D) Fold changes of the annotated microbes at the genus level. The data of log2FC are expressed as mean. Group differences were assessed by using the Mann‐Whitney U test. *P < 0.05.

