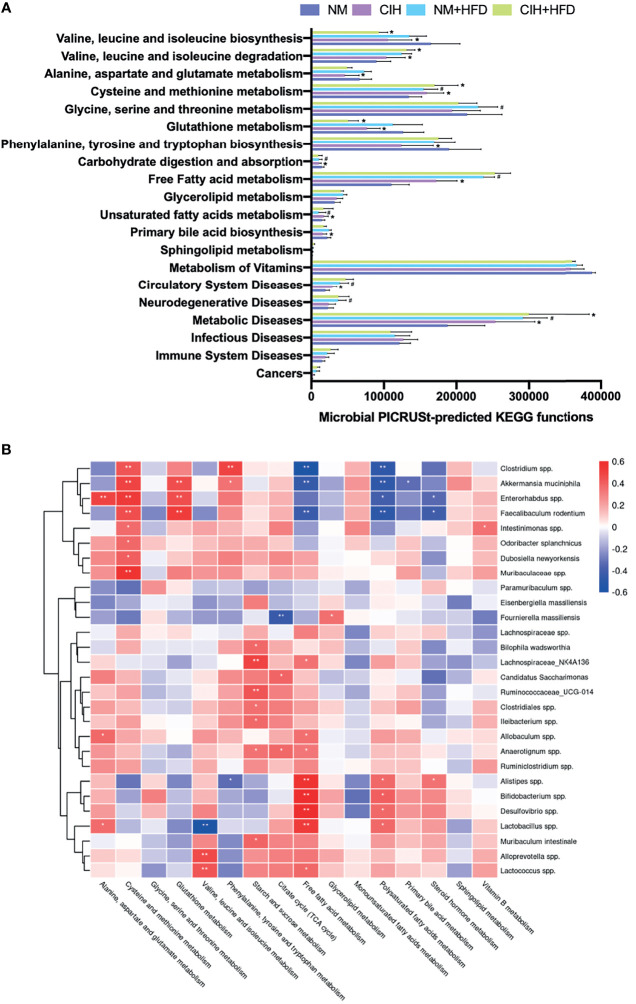
Figure 8.
CIH-related fecal microbiota functional changes and correlations between the host metabolome and fecal microbiome. (A) Microbial PICRUSt‐predicted KEGG functions relevant to metabolism and diseases. Data are expressed as mean ± SEM. Group differences were assessed by using the Mann‐Whitney U test. *P < 0.05 when comparing NM vs CIH, or NM+HFD vs CIH+HFD. #P < 0.05 when comparing NM vs NM+HFD. (B) Spearman correlations of the relative abundance of fecal microbial genus or species and the abundance of metabolite pathways in host serum (n = 36). The r values are represented by gradient colors, with red cells indicating positive correlations and blue cells indicating negative correlations. *P < 0.05, and **P < 0.01.

