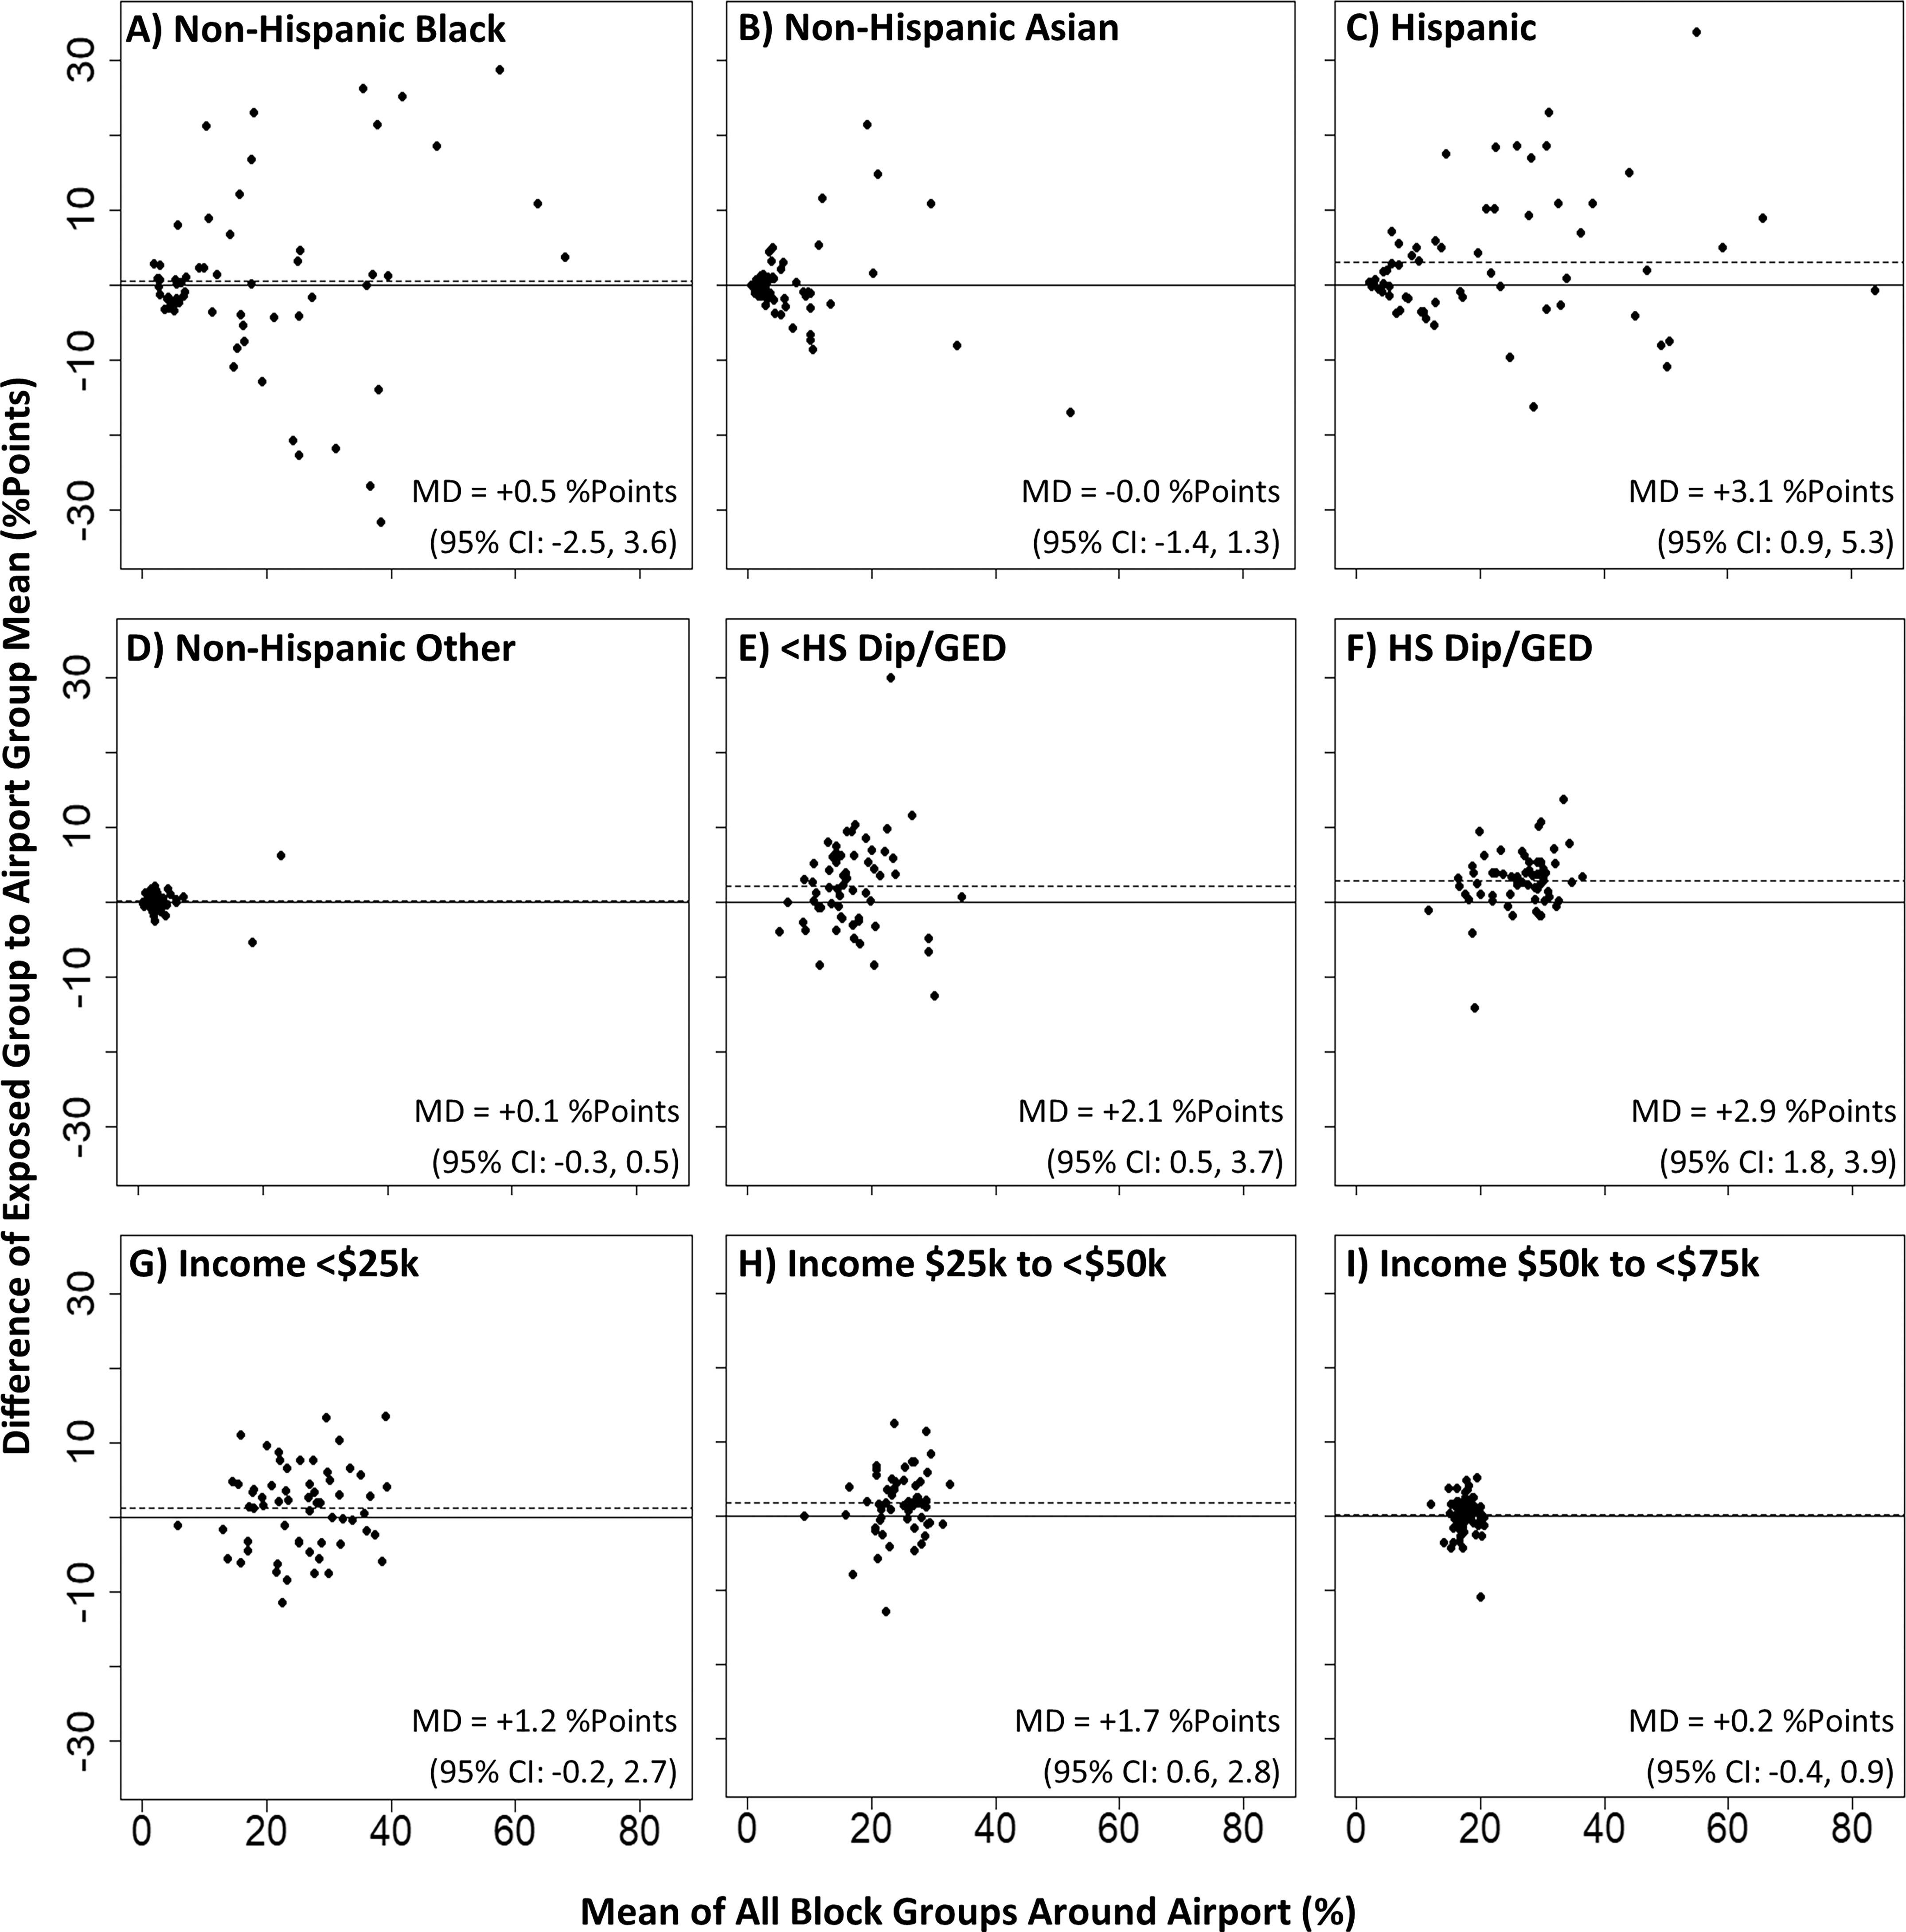
Figure 3.

Mean-difference plots for socially vulnerable groups: (A) non-Hispanic black, (B) non-Hispanic Asian, (C) Hispanic, (D) non-Hispanic other, (E) no high school diploma or GED, (F) high school diploma or GED only, (G) annual household income , (H) annual household income to , and (I) annual household income to . In (A–I), each airport-specific relationship is represented by a point (), where the x-axis is the mean of the percentage socially vulnerable group for all block groups within the maximum extent and the y-axis is the mean difference between the percentage exposed for the socially vulnerable group and the airport mean. Airports above the zero line were those found to have block groups with a greater percentage of socially vulnerable groups within the 55-dB(A) noise contour than the mean of all block groups around that airport (i.e., more exposed). Airports below the zero line were those found to have block groups with a lower percentage of socially vulnerable groups within the 55-dB(A) noise contour than the mean of all block groups around that airport (i.e., less exposed). Points along the zero line are airports where there is no difference in percentage socially vulnerable groups within the DNL 55-dB(A) contour (i.e., exposed) relative to the airport mean. Dashed lines represent the mean of the mean differences across all airports. Note: CI, confidence interval; DNL, day–night average sound level; GED, General Education Development; HS dip, high school diploma; k, thousand; MD, mean difference.
