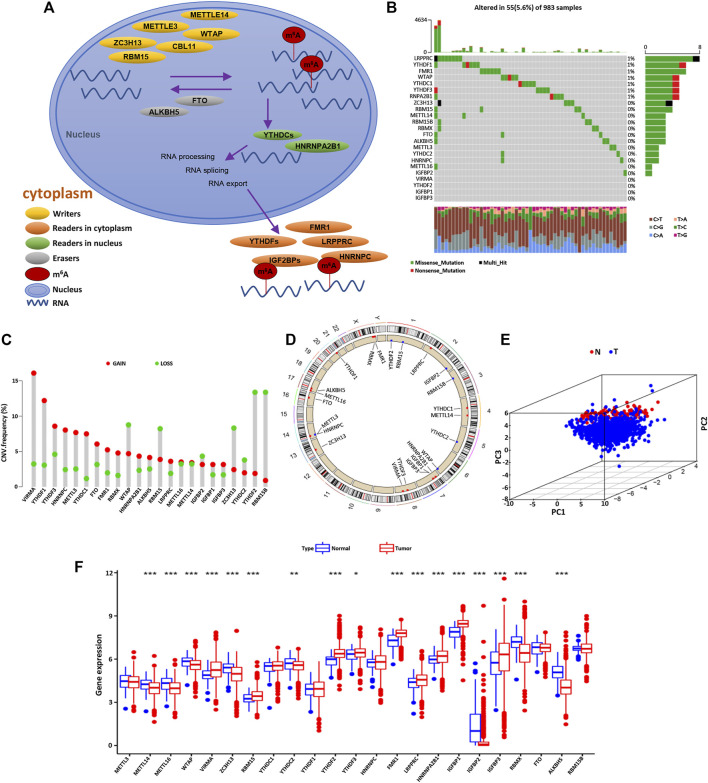
FIGURE 1.
The molecular characteristics and expression variation landscape of m6A regulators in BC. (A) Summary of the biological process and potential biological functions of the m6A methylation modified by regulators (writers, erasers, and readers). (B) Mutation frequencies of 23 m6A regulators in 983 patients with BC in the TCGA database. Each column represents a single patient, the bar chart above represents TMB, and the number on the right represents the mutation frequency of each regulator. The bar chart on the right shows the proportion of various types of each regulator. The stacked bar chart below shows the percentage of conversion in each sample. (C) The CNV frequency of m6A regulators in BC. The green dot represents the deletion frequency, the red dot represents the amplification frequency, and the height of the column represents the change frequency. (D) The position of the m6A regulator CNV on 23 chromosomes. (E) PCA based on the expression profiles of 23 m6A regulators is used to distinguish tumor tissues from normal tissues. The tumor is marked with blue and the normal breast tissue with red. (F) The expression of 23 m6A regulators in normal breast tissue (blue) and tumor tissue (red). The top and bottom of the box represent the quartile range of values. The line in the box represents the median value, and the asterisk above represents the statistical p value (*p < 0.05, **p < 0.01, ***p < 0.001).

