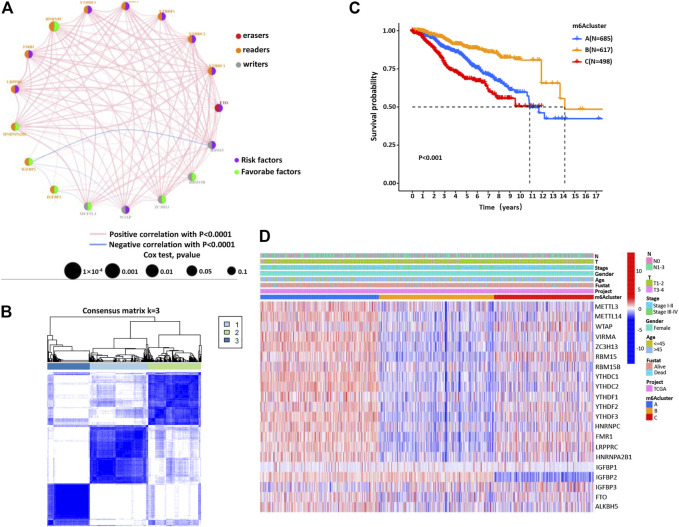
FIGURE 2.
The m6A methylation patterns and their biological characteristics. (A) The interaction between m6A regulators in BC. The size of the circle represents the influence of each regulator on the BC prognosis. Orange for readers, gray for writers, and red for erasers. Green dots represent favorable prognostic factors and purple dots represent risk factors. The spectral lines connecting the m6A regulators represent the interaction between them, and the thickness represents the correlation strength between the regulatory factors. The pink line is a positive correlation, and the blue line is a negative correlation. (B) Consensus clustering matrix for k = 3. (C) Kaplan–Meier curves of OS for three m6Acluster in BC patients. (D) Unsupervised clustering of 23 m6A regulators in BC patients. m6Acluster, lymph node stage, T stage, tumor stage, survival status, and age are used as the annotation of BC patients. Red represents high expression and blue represents low expression.

