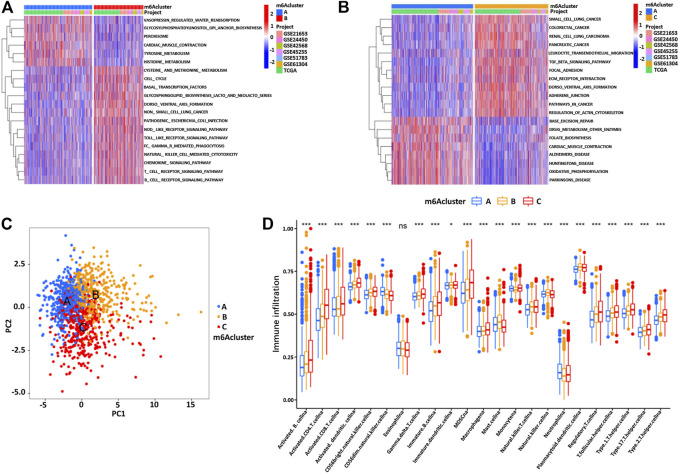
FIGURE 3.
(A,B) The GSVA enrichment analysis of biological pathway activation under different m6Aclusters. Red represents the activation pathway and blue represents the inhibition pathway. (A) m6Acluster A compared with m6Acluster B. (B) m6Acluster A compared with m6Acluster C. (C) PCA shows significant differences in the transcriptome profiles of three m6Aclusters. (D) The expression abundance of different TME infiltrating cells in three m6Aclusters. The upper and lower end of the box represents the quartile range of the value, the middle line represents the median value, and the asterisk represents the statistical p value (*p < 0.05, **p < 0.01, ***p < 0.001).

