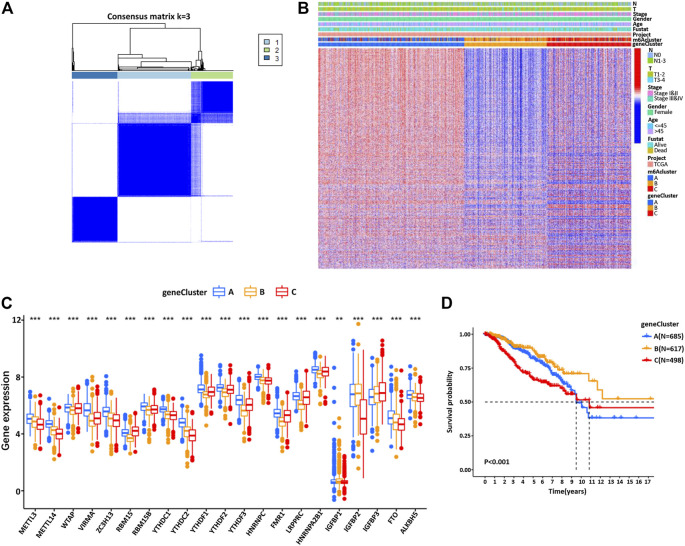
FIGURE 5.
(A) Pearson correlation analysis was used to explore the relationship between the m6A regulators, and the common clustering matrix of k = 3 was selected. (B) In the BC cohort, the unsupervised clustering analysis of the m6A phenotype-related genes overlapped and divided the patients into different genomic subtypes, named m6A gene clusters A, B, and C, respectively. Gene clusters, m6Aclusters, BC stage, T stage, lymph node metastasis stage, survival status, and patient age were annotated. (C) The expression of 23 m6A regulators in three gene clusters. The top and bottom of the box represent the quartile range. The middle line represents the median value, and the asterisk represents the statistical p value (*p < 0.05, **p < 0.01, ***p < 0.001). The differences among the three gene clusters are tested by one-way ANOVA. (D) Kaplan–Meier survival curve showed that m6A gene-modified phenotype was correlated with the OS rate in BC patients.

