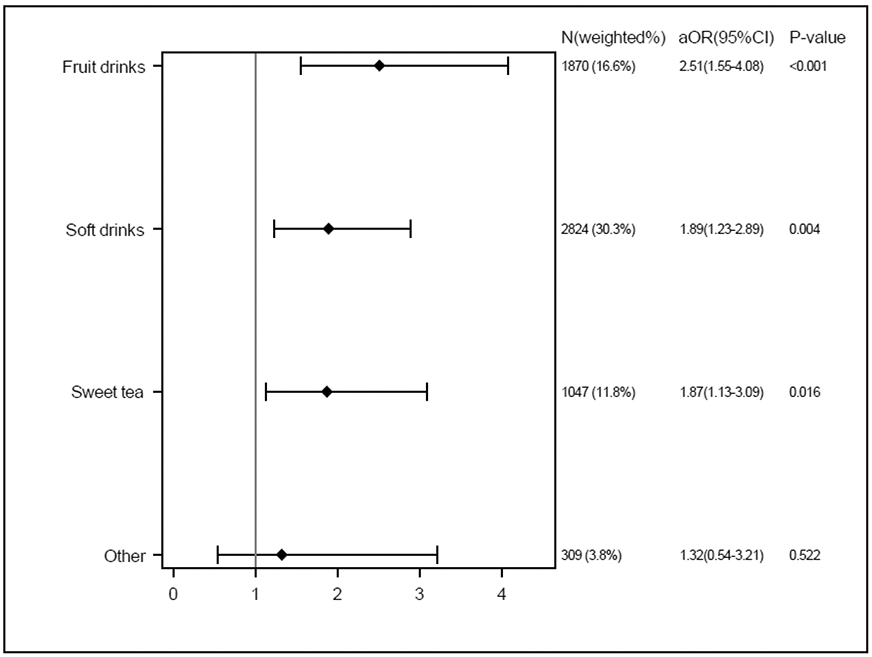
Figure 2.

Adjusted odds of current asthma by sugar-sweetened beverage product type.
Note.
No sugar-sweetened beverage consumption is the reference group (n=3888, 37.5%).
Multivariable logistic regression adjusted for age, sex, race/ethnicity, family income, body mass index percentile, and SSB consumption status (non-drinker vs. heavy drinker and non-drinker vs. moderate drinker).
