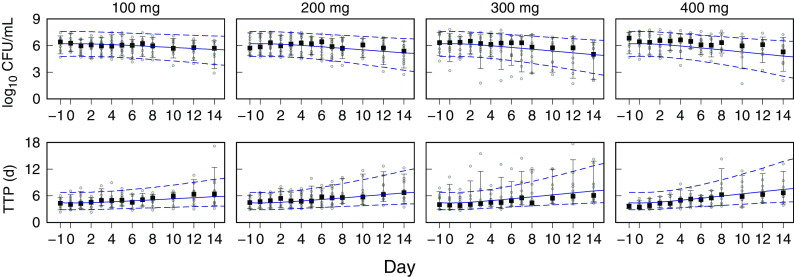
FIG 3.
Visual predictive check for CFU and time to positivity (TTP). Observed and model-predicted data for the 100-mg, 200-mg, 300-mg, and 400-mg dose groups from study days −1 and 0 (pretreatment) and days 1 to 8, 10, 12, and 14 are shown. Points, observed data; square points, medians; error bars, 5th and 95th percentiles. For model-predicted Monte Carlo (MC) distributions, medians (solid lines) and 5th and 95th percentiles (dashed lines) are shown. The MC distribution sample size was 10,000.

