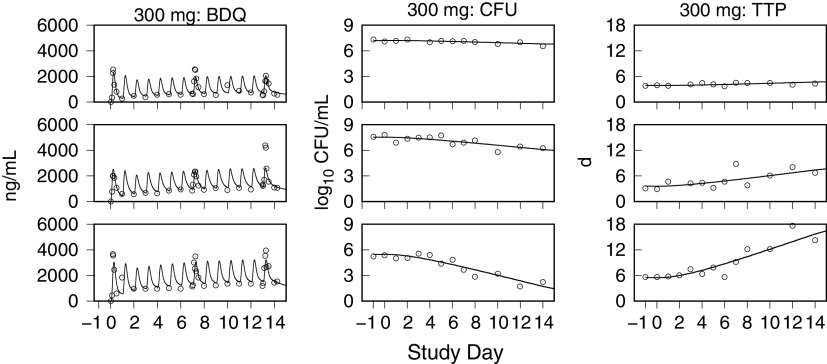
FIG 6.
Representative exposure-response profiles for low (top row), intermediate (middle row), and high (bottom row) drug kill rates from the 300-mg dose group. For individual bedaquiline (BDQ) plasma concentrations, CFU per milliliter of sputum, and time to positivity (TTP), observed (points) and predicted (lines) values from pretreatment through day 14 are shown.

