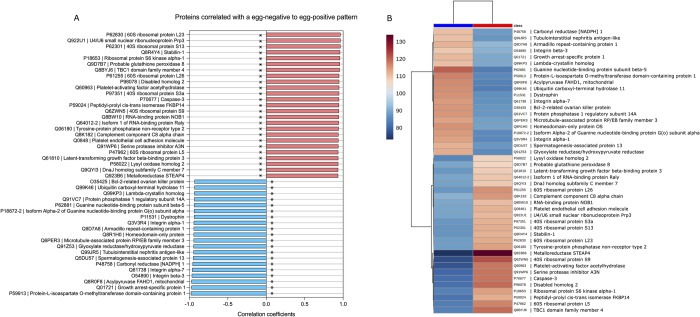
Fig 3.
a) Pattern correlation analysis of the 45 proteins (DEPs), showing increasing and decreasing patterns relative to S. haematobium egg status. Correlation coefficients indicate correlation pattern or protein abundance trends relative to the S. haematobium egg injection group. Pink and blue bars indicate a positive and negative correlation with S. haematobium egg-injection respectively. *, raw p <0.001 and FDR <0.05. b) Clustering and heatmap of significantly differentially expressed proteins among the S. haematobium egg-injection group (cases) and the tissue extract-injection group (controls). The heat map was created based on the mean relative abundance of the 45 significant differentially expressed proteins (distance measure using Euclidean, clustering algorithm–Ward’s linkage). Red class label indicates the case group, and the blue class label represents the control group.

