
Figure 4.
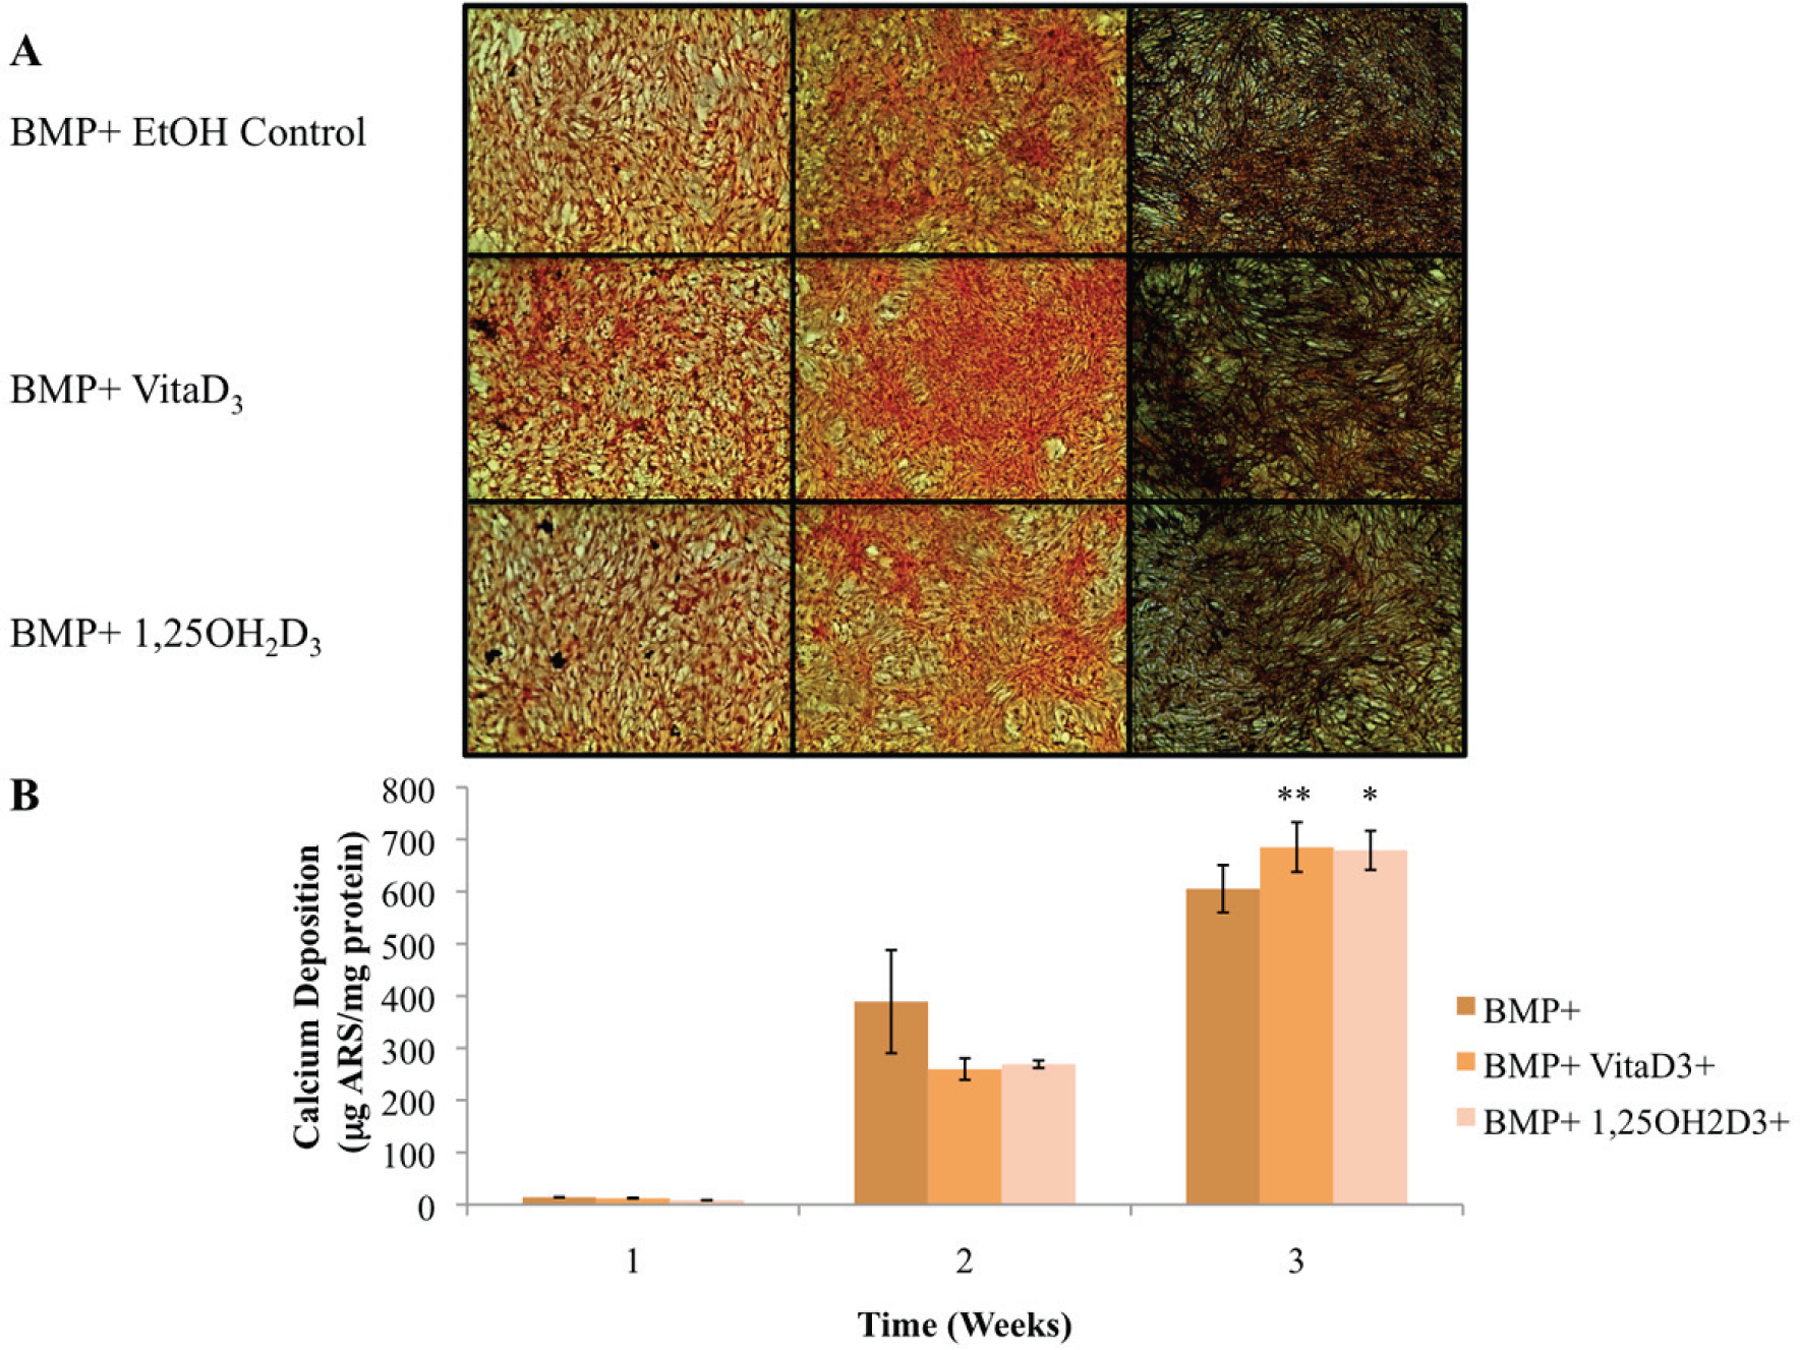
(A) OPC1 calcium deposition as stained with ARS during culture in BMP+ containing rhBMP-2 (BMP+) and either vitamin D3 or 1,25OH2D3. (B) Quantified ARS as extracted from each culture well and read on a microplate reader. In the second week of culture, the BMP+ EtOH control had a larger amount of calcium deposition in comparison with the treatment groups (P < 0.05). By week three of culture, there was more calcium deposition detected by ARS in cells treated with either vitamin D metabolites compared to that of the ethanol control (*P < 0.01). In addition, there was a statistically more calcium deposition in the BMP+ treatment groups (P < 0.001) compared to all BM− groups (plotted in Fig. 2).