
Figure 6.
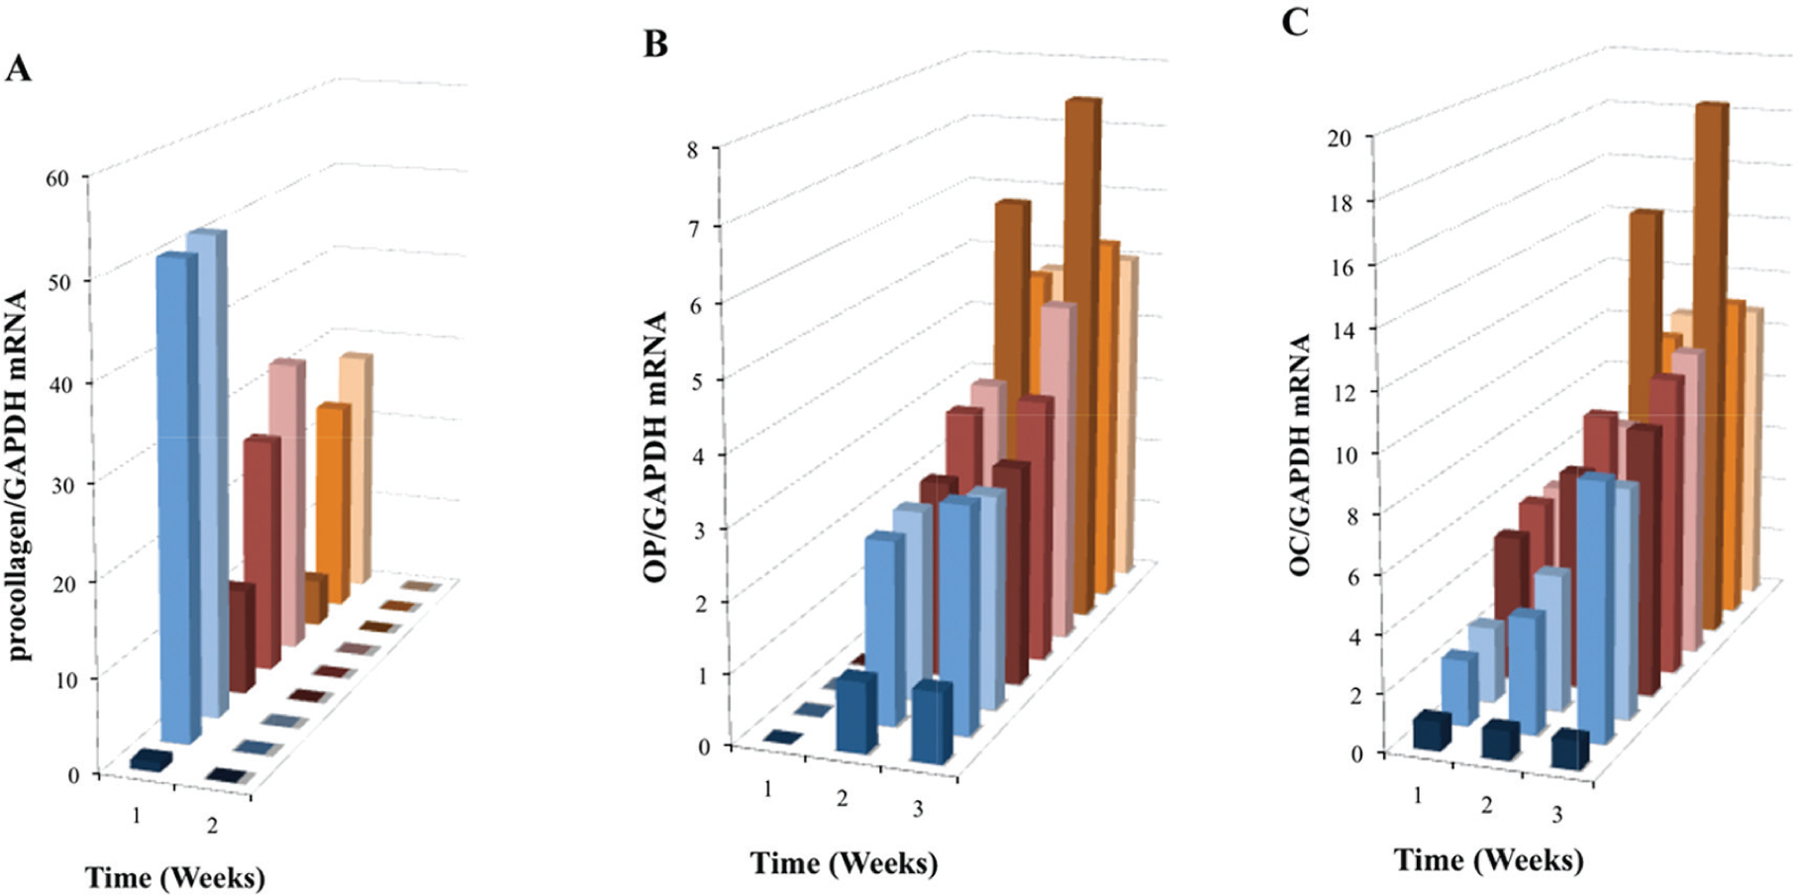
Induced mRNA expression of (A) proColI, (B) OP and (C) OC in nine treatment group OPC1 cultures containing the vitamin D metabolites and/or osteogenic factors (see the figure legend for Fig. 5A). Total RNA was isolated and examined by quantitative RT-PCR and data were again normalized by levels of GAPDH.