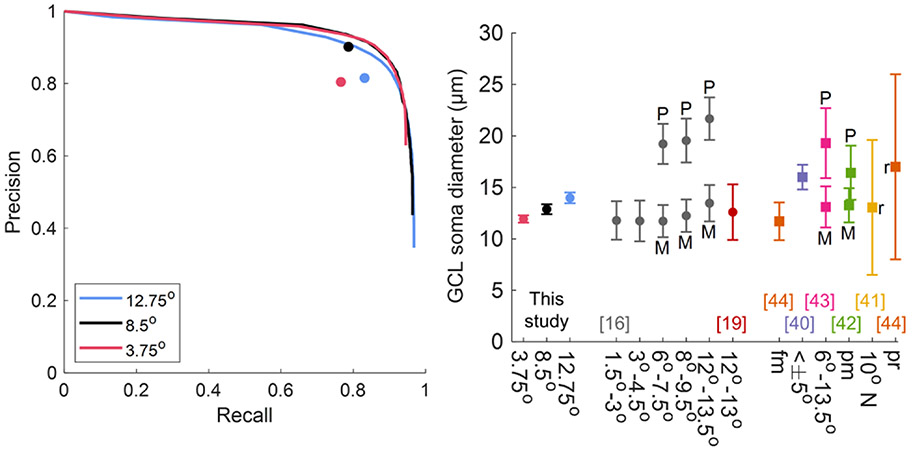
Fig. 2.
Results on IU’s dataset. (A) Average precision-recall curves of WeakGCSeg compared to average expert grader performances (circle markers). Each plotted curve is the average of eight and five curves at the same threshold values for the 3.75°/12.75° and 8.5° data, respectively. (B) GCL soma diameters across all subjects compared to previously reported values. Circle and square markers denote mean soma diameters from in vivo and histology studies, respectively. Error bars denote one standard deviation. “r” denotes the range of values. P, parasol GCs; M, midget GCs; fm, foveal margin; pm, papillomacular; pr, peripheral retina.

