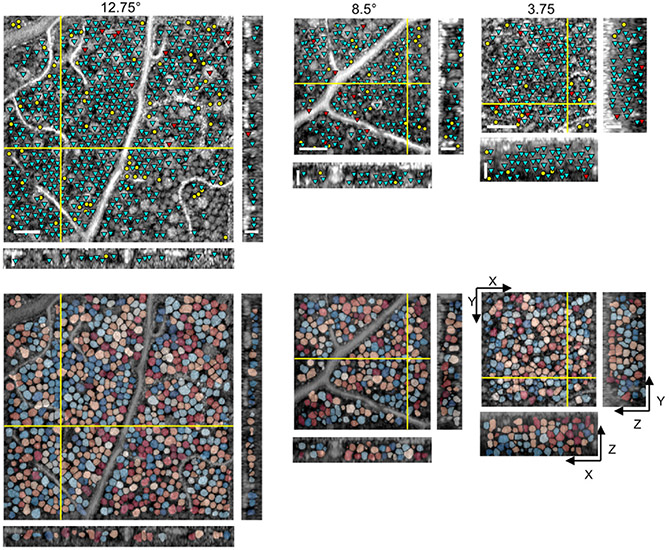
Fig. 3.
En face (XY) and cross-sectional (XZ and YZ) slices illustrate (top) soma detection results compared to the gold-standard manual markings and (bottom) overlay of soma segmentation masks, with each soma represented by a randomly assigned color. Cyan, red, and yellow markers denote TP, FN, and FP, respectively. Only somas with centers located within 5 μm from the depicted slices are marked in the top row. The intensities of AO-OCT images are shown in log-scale. Scale bars: 50 μm and 25 μm for en face and cross-sectional slices, respectively.

