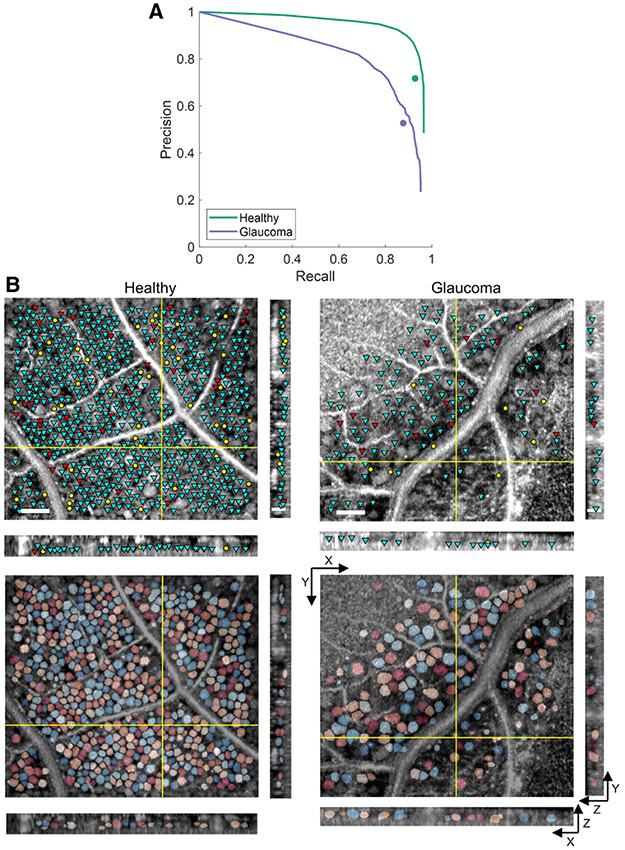
Fig. 4.
Results on FDA’s healthy and glaucoma subjects. (A) Average precision-recall curves compared to average expert grader performances (circle markers). Each plotted curve is the average of six and 10 curves for the healthy and glaucoma volumes, respectively. (B) En face (XY) and cross-sectional (XZ and YZ) slices illustrating soma detection and segmentation results. See Fig. 3 for further details.

