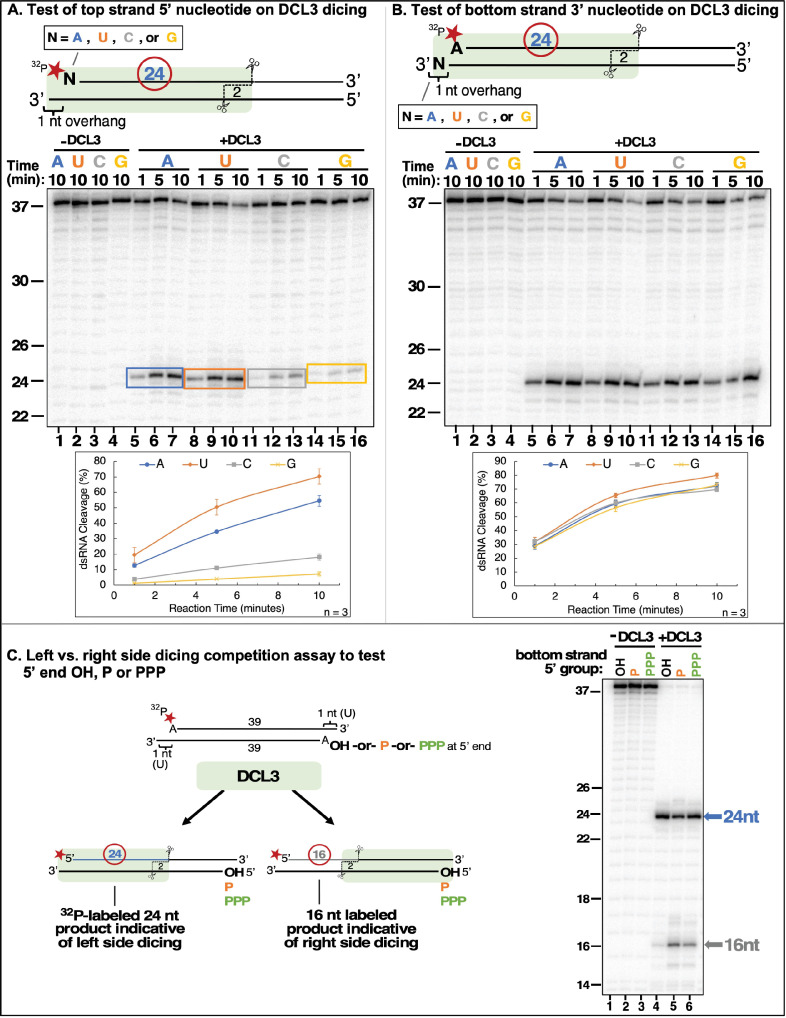
(A) Test of top strand 5′ nucleotide preference on dicing efficiency. Top strands of 37 nt that differ by having either A, U, C, or G at their 5′ termini were 5′ end-labeled with 32P and annealed to complementary 38 nt bottom strand RNAs to generate 1 nt 3′ overhangs on the left side, as drawn. Following incubation with DCL3 for 1, 5, or 10 min, reaction products were resolved by non-denaturing PAGE and visualized by autoradiography. The diagram highlights the position of the labeled 24 nt dicing product measured in the assay. (B) Test of bottom strand 3′ terminal nucleotide on dicing efficiency. This experiment was conducted as in (A) except that bottom strands had either A, U, C, or G at their 3′ termini, which overhang the top strand (5′ A) by 1 nt. (C) Test of top strand 5′ end phosphorylation on dicing efficiency. Two 37 nt RNA strands with adenosines at their 5′ termini were annealed to generate dsRNAs with 3′ overhangs of 1 nt at either end, encouraging DCL3 to dice from either end. The top strand was end-labeled with a 32P monophosphate group whereas the 5′-terminal adenosine of the bottom strand had either a hydroxyl group (OH), a monophosphate (P) or a triphosphate (PPP). Left-side versus right-side dicing was then assessed by the ratio of labeled 24 or 16 nt dicing products following non-denaturing PAGE and autoradiography.
Figure 4—source data 1. Gel image used in Figure 4A.Duplicate digital images obtained by phosphorimaging of
32P-labeled RNAs resolved by denaturing PAGE are shown, with red rectangles showing the portion of the raw image used in
Figure 4A.
Figure 4—source data 2. Gel image of replicate experiment providing quantitative data for Figure 4A.
Figure 4—source data 3. Gel image of replicate experiment providing quantitative data for Figure 4A.
Figure 4—source data 4. Source quantitative data for triplicate experiments of Figure 4A.Data was obtained using Image Lab version 6.0 software. The 38 nt substrate and 24 nt diced RNA bands were boxed and % dsRNA substrate cleavage was calculated as the percentage of total signal (substrate + product) represented by the 24 nt product RNA band. Means for the triplicate reactions were calculated as well as the standard error of the mean.
Figure 4—source data 5. Gel image used in Figure 4B.Duplicate digital images obtained by phosphorimaging of
32P-labeled RNA resolved by denaturing PAGE are shown, with red rectangles showing the portion of the raw image used in
Figure 4B.
Figure 4—source data 6. Gel image of replicate experiment providing quantitative data for Figure 4B.
Figure 4—source data 7. Gel image of replicate experiment providing quantitative data for Figure 4B.
Figure 4—source data 8. Source quantitative data for triplicate experiments of Figure 4B.Data was obtained using Image Lab version 6.0 software. The 38 nt substrate and 24 nt diced RNA bands were boxed and % dsRNA substrate cleavage was calculated as the percentage of total signal (substrate + product) represented by the 24 nt product RNA band. Means for the triplicate reactions were calculated as well as the standard error of the mean.
Figure 4—source data 9. Source data for Figure 4C.Duplicate gel images obtained by phosphorimaging of 32P-labeled RNA resolved by denaturing PAGE. The red rectangle in the image on the right shows the portion of the raw image used in the figure.

